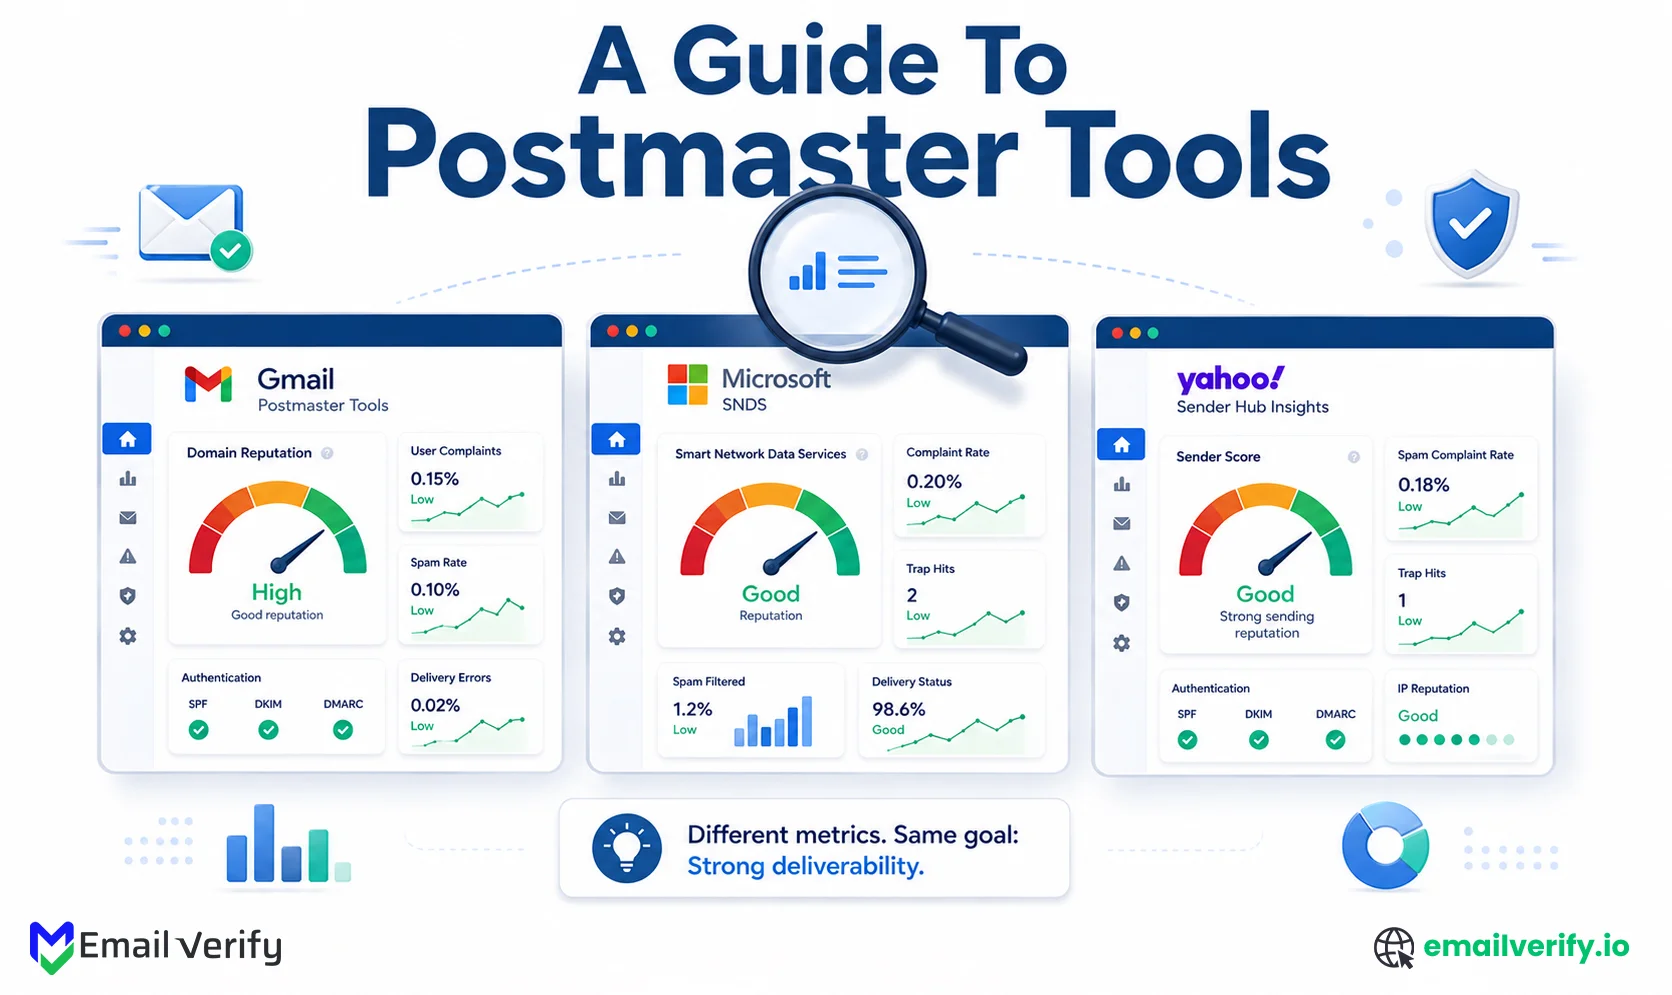
Postmaster tools are the most reliable source of email deliverability data available to senders. Gmail Postmaster Tools v2, Microsoft SNDS, and Yahoo Sender Hub Insights show how major mailbox providers actually view your spam rate, authentication, complaint levels, filtering behavior, and sender reputation, using first-party data no third-party tool can fully replicate.
Most teams set up these dashboards but struggle to interpret the numbers.
What does a 0.18% Gmail spam rate actually mean? How serious is a Yellow SNDS filter result? Which metrics require immediate action, and which fluctuations are safe to ignore?
This article explains how to read the most important postmaster metrics across Gmail, Microsoft, and Yahoo. It covers Gmail compliance status, SNDS complaint rates and trap hits, Yahoo’s inbox-delivered complaint methodology, authentication failures, and delivery errors.
The article is fully updated for the 2025–2026 deliverability landscape, including the Gmail Postmaster Tools v1-to-v2 transition and the launch of Yahoo Sender Hub Insights.
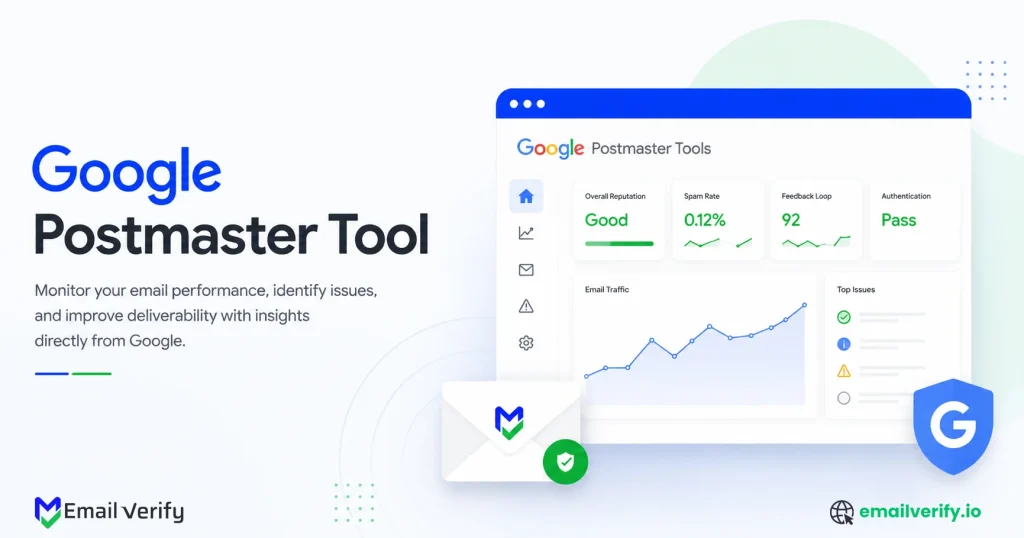
Postmaster tools are free dashboards from Gmail, Microsoft, and Yahoo that show how mailbox providers view your sending reputation and deliverability. They are the most authoritative source of email performance data because they come directly from inbox providers.
They include Gmail Postmaster Tools v2, Microsoft SNDS, and Yahoo Sender Hub Insights.
Key metrics to watch
- Gmail Spam Rate: <0.1% ideal (0.3%+ is risky)
- Gmail Authentication: 99%+ pass rate
- Gmail Compliance: Pass / Needs Work
- Microsoft SNDS: Green = good, Yellow = risk, Red = severe
- Microsoft Complaints: >0.1% = problem
- Yahoo Complaint Rate: inbox-delivered based
Minimum volume needed
- Gmail: ~200/day (5,000+ for Compliance view)
- Microsoft SNDS: ~100/day
- Yahoo: consistent sending with verified DKIM
Table of Contents
Why Are Postmaster Tools the Authoritative Signal?
Postmaster tools are the only first-party deliverability data source, provided directly by Gmail, Microsoft, and Yahoo. They show how each mailbox provider actually evaluates your sending reputation, spam rate, authentication, and filtering behavior.
Third-party tools like Sender Score, GlockApps, and Validity Everest estimate reputation using external signals. Postmaster tools reflect what the providers themselves see. When the two disagree, provider data always takes priority.
This is also why Postmaster Tools form the foundation of any serious deliverability program, they are free, direct, and not based on inference.
To understand how these signals compare, it helps to look at the hierarchy of deliverability data sources:
| Source | What it shows | Authority |
|---|---|---|
| Postmaster tools (Gmail, Microsoft, Yahoo) | Provider’s actual view of your sending. | Authoritative, ground truth. |
| Seed-list testing (GlockApps, MailReach) | Inbox placement at synthetic test addresses. | Indirect, sample-based estimate. |
| Third-party reputation (Sender Score, Talos) | Estimated reputation based on external signals. | Indirect, not provider-derived. |
| ESP delivery reporting | Whether messages were accepted (no bounce). Not inbox vs. spam placement. | Limited, doesn’t see placement. |
While all four layers provide useful context, only postmaster tools reflect actual provider-side decisions that impact inbox placement.
For example, if Sender Score shows 92 but Gmail Postmaster Tools reports a 0.4% spam rate, Gmail’s data is what determines real-world delivery outcomes.
This is why postmaster tools should always be the first layer of deliverability monitoring in any sending system.
If you still rely primarily on third-party reputation tools, you’re not working with the source of truth.
Set up Gmail Postmaster Tools, Microsoft SNDS, and Yahoo Sender Hub Insights as your baseline monitoring layer. Setup typically takes 1–2 hours, and data begins populating within 24–48 hours.
These tools surface provider-level issues earlier than third-party platforms and clearly indicate which mailbox provider is responsible for deliverability changes.
The 2025 Gmail Postmaster Tools v1-to-v2 Shift
Google retired Gmail Postmaster Tools v1 between September 30 and October 31, 2025, replacing it with Postmaster Tools v2. The biggest change is the removal of the Domain Reputation and IP Reputation dashboards, which used the four-tier Bad/Low/Medium/High system many teams relied on for monitoring.
In v2, these are replaced by the Compliance Status dashboard, which evaluates senders against Gmail’s bulk-sender requirements using a binary Pass / Needs Work output. If you still reference reputation tiers in internal documentation, those workflows are now outdated.
Here’s a breakdown of what changed from v1 to v2:
| v1 dashboard | Status in v2 | Replacement |
|---|---|---|
| Domain Reputation | Removed. | Compliance Status (binary Pass/Needs Work). |
| IP Reputation | Removed. | No direct replacement; subsumed into Compliance Status. |
| Spam Rate | Retained, with added threshold lines (0.10% recommended, 0.30% policy). | — |
| Authentication | Retained. | — |
| Encryption | Retained. | — |
| Delivery Errors | Retained. | — |
| Feedback Loop | Retained. | — |
| Compliance Status | New in v2. | — (Replaces reputation as the headline metric.) |
Why Google made the change
Google shifted from reputation scoring to compliance-based evaluation because it is more actionable. The old four-tier system indicated that something was wrong, but not what to fix.
The Compliance Status dashboard aligns directly with Gmail’s bulk-sender requirements introduced in 2024. When it shows “Needs Work,” it also highlights the exact failing requirement, reducing ambiguity and improving remediation speed.
For deliverability teams, this changes how signals are interpreted. Instead of relying on a single reputation tier, teams now correlate spam rate, authentication, and compliance status to understand overall sender health. Marketing teams lose the simplicity of “high = good” but gain more precise diagnostic insight.
Don’t look for domain or IP reputation in v2, they no longer exist.
If your docs still reference “High/Medium/Low/Bad” or reputation drops, they need updating. Replace them with Spam Rate trends and Compliance Status (Pass / Needs Work), which are the actual signals used in v2.
Gmail Postmaster Tools v2: Setup and Volume Requirements
Setup is straightforward but has volume requirements that catch low-volume senders by surprise.
Setup steps (under 10 minutes)
- Go to postmaster.google.com and sign in with a Gmail or Workspace account
- Click the + icon to add your sending domain
- Add the root domain (e.g., yourdomain.com), not just a subdomain
- If you send from multiple subdomains (mail, marketing, etc.), add each one separately, they are tracked independently
- Verify ownership by adding a TXT record provided by Google in your DNS
- Wait 24–48 hours for data to appear (some dashboards require minimum volume)
Volume thresholds
Postmaster Tools v2 uses volume levels that determine what data becomes visible:
| Volume to Gmail | What’s visible |
|---|---|
| Under ~100/day | Most dashboards show “insufficient data." The tool is largely unusable. |
| ~100–200/day | Spam rate and authentication populate sporadically. Other dashboards may be empty. |
| 200–5,000/day | Most dashboards populate. Spam rate, authentication, encryption, and delivery errors are visible. |
| 5,000+/day since January 1, 2024 | The compliance status dashboard becomes available. This is the bulk-sender threshold. |
The 5,000+ daily email threshold is critical. Below this level, the Compliance Status dashboard does not appear at all, meaning the Pass / Needs Work signal is unavailable.
Verifying the right domains
Postmaster Tools tracks each domain separately. Subdomains do not roll up into the root domain in v2. If you send from multiple domains or subdomains, each must be verified individually.
Common setup patterns:
- Root domain (yourdomain.com): transactional or executive email
- Marketing subdomain (marketing or news): bulk campaigns
- Notification subdomain (notify): system-generated emails
- Sales subdomain (sales): cold outreach
If only one domain is verified, you will only see partial data and may miss reputation issues across other sending streams.
Reading Gmail v2: Compliance Status Dashboard
The Compliance Status dashboard is the main signal in Gmail Postmaster Tools v2. It shows a simple result: Pass or Needs Work.
It checks whether your emails follow Gmail’s bulk-sender requirements, including SPF, DKIM, DMARC, one-click unsubscribe, and spam rate limits under 0.3%.
If the status is “Pass,” your sending is compliant. If it shows Needs Work, at least one requirement is failing, and the dashboard tells you exactly which one.
This is the most actionable view in Postmaster Tools because it doesn’t just indicate a problem; it points to the exact cause. It is only available to senders sending 5,000+ emails per day to Gmail recipients.
| Gmail Postmaster Tools v2 — Spam Rate (example: healthy) | |
|---|---|
| User-reported spam rate (last 7 days) 0.04% | Below the 0.10% recommended threshold. Trend is stable. No action required. Continue current segmentation and content practices. |
| User-reported spam rate (last 7 days) 0.18% | Above 0.10% recommended threshold. If trend is rising, address this week before it crosses 0.30% policy violation line. Review recent campaigns and segments. |
What the Compliance dashboard actually checks
The dashboard is a checklist that maps to Gmail’s bulk-sender requirements:
| Requirement | What it checks | Threshold |
|---|---|---|
| SPF authentication | SPF record exists and authorizes sending IPs. | Pass rate near 100%. |
| DKIM authentication | DKIM signature validates correctly. | Pass rate near 100%. |
| DMARC alignment | DMARC policy at minimum p=none with SPF or DKIM aligned to From: domain. | Alignment near 100%. |
| One-click unsubscribe | List-Unsubscribe and List-Unsubscribe-Post headers present (RFC 8058). | Header present on all bulk mail. |
| Honor unsubscribes | Unsubscribe requests processed within 2 days. | Compliance with 2-day window. |
| Spam rate | User-reported spam rate from Gmail recipients. | Below 0.30% (recommended below 0.10%). |
| TLS encryption | Inbound mail accepted over TLS. | Near 100%. |
The Compliance dashboard uses rolling averages over multiple days, so improvements don’t show instantly. Fixing an authentication issue today may take 5–7 days to flip the dashboard from Needs Work to Pass. Track the change in trend, not just the immediate state.
The Compliance dashboard is your weekly priority check. Spend 30 seconds on it: if it shows Pass, move on to Spam Rate. If it shows Needs Work, click into it to see which specific requirement is failing, then fix that issue this week.
The dashboard’s biggest practical value is that it surfaces the one specific thing you need to fix, not a generic “reputation is low” message that requires guesswork to action.
Reading Gmail v2: Spam Rate Dashboard
The Spam Rate dashboard shows the daily percentage of your Gmail-delivered mail that recipients marked as spam. It’s now the single most important metric in v2 (since the reputation dashboards were removed). Threshold lines: 0.10% (recommended ceiling) and 0.30% (policy violation). Above 0.30%, Gmail begins active filtering and rejection. Best practice is to operate consistently below 0.10% with monitoring above 0.05%.
Spam Rate is the single most important Gmail metric. With Domain Reputation and IP Reputation gone in v2, Spam Rate is the metric Gmail actually uses to make routing decisions. Treat it as the headline number. Check it daily during active campaigns; check it weekly otherwise.
| Gmail Postmaster Tools v2 — Spam Rate (example: healthy) | |
|---|---|
| User-reported spam rate (last 7 days) 0.04% | Below the 0.10% recommended threshold. Trend is stable. No action required. Continue current segmentation and content practices. |
| User-reported spam rate (last 7 days) 0.18% | Above 0.10% recommended threshold. If trend is rising, address this week before it crosses 0.30% policy violation line. Review recent campaigns and segments. |
What the spam rate actually measures
Spam rate is calculated as: emails marked as spam by recipients divided by emails delivered to engaged Gmail inboxes. Three things to know about the calculation:
- It only counts engaged Gmail inboxes — Gmail doesn’t include mail delivered to inactive accounts in the denominator.
- It counts user-reported spam, not algorithmic spam classification. A user has to actively click “Report spam” for it to count.
- Gmail does not pass back individual user complaints due to privacy. You see the rate, not which specific recipients reported you.
Because Gmail doesn’t expose user-level complaints, you have to correlate spam rate spikes with campaign-level data on your side. If spam rate jumped on a specific day, look at what campaigns went out that day and to which segments — that’s usually how you identify the cause.
Don’t panic over isolated single-day spikes on quiet sending days. On low-volume days, a single complaint can produce a misleading spike (1 complaint out of 100 sends = 1.0% spam rate). Always look at the 7-day or 30-day trend during days with meaningful sending volume. Persistent climb across multiple days is the action signal; isolated spikes during low-volume periods are usually noise.
Reading Gmail v2: Authentication, Encryption, Delivery Errors
Authentication, Encryption, and Delivery Errors are support dashboards in Gmail Postmaster Tools v2. They don’t drive routing decisions on their own, but they explain why deliverability issues are happening when Spam Rate or Compliance Status starts to degrade.
Authentication dashboard
The authentication dashboard tracks SPF, DKIM, and DMARC pass rates. Healthy senders should consistently stay at 99%+ across all three.
| Status | Range | What to do |
|---|---|---|
| ✓ OK | 99–100% | Authentication is healthy. Periodic review only. |
| ⚠ Watch | 95–99% | Slight authentication failures. Common cause: third-party tools (CRM, support ticketing, marketing automation) sending unauthenticated mail. Audit all sending sources. |
| ✖ Act now | < 95% | Significant authentication problem. Misconfigured DNS records, broken DKIM signing, or unauthorized senders. Fix this week; mail is failing alignment and getting filtered. |
Most issues appear when SPF and DKIM pass, but DMARC alignment drops because the From domain doesn’t match the authenticated domain. This is the most common failure pattern in v2.
Encryption dashboard
The Encryption dashboard shows how much of your mail is delivered over TLS. In 2026, the expected baseline is 100% TLS adoption.
| Status | Range | What to do |
|---|---|---|
| ✓ OK | 100% | Healthy. No action. |
| ⚠ Watch | 98–99% | Edge cases of unencrypted send. Audit outbound configuration for any legacy SMTP relays or specific accounts not using TLS. |
| ✖ Act now | < 98% | Material amount of unencrypted mail. Modern Gmail expects 100%; under-100% can affect compliance status. Fix the sending infrastructure immediately. |
Any drop below 100% usually points to legacy infrastructure still sending unencrypted traffic.
Delivery Errors dashboard
This dashboard categorizes SMTP failures returned by Gmail. It helps diagnose why mail is rejected, deferred, or throttled. Errors fall into two types:
- 4xx errors: Temporary issues (throttling, retry later)
- 5xx errors: Permanent failures (blocks, policy rejection)
A spike in 4xx usually means rate limiting. A spike in 5xx indicates reputation or compliance issues. Mixed patterns suggest multiple underlying problems.
Reading Gmail v2: Feedback Loop Dashboard
The Feedback Loop dashboard tracks complaint data using a Feedback-ID header you attach to outgoing email. Instead of identifying individual users, Gmail aggregates complaints per ID (campaign, template, or segment).
This makes it possible to pinpoint which sending unit is responsible for complaints.
How it works
- You add a Feedback-ID header to outgoing mail
- Gmail groups complaints under that ID
- The dashboard displays complaint volume per ID over time
- You map IDs back to campaigns or segments in your ESP
Most modern ESPs like SendGrid, Iterable, Customer.io, and Klaviyo support this automatically.
What the dashboard reveals
- A specific campaign ID driving unusually high complaints
- A template gradually increasing in complaint rate
- A segment consistently reacting negatively to content
- A stable baseline across all IDs (healthy sending pattern)
Microsoft SNDS: Setup and What It Covers
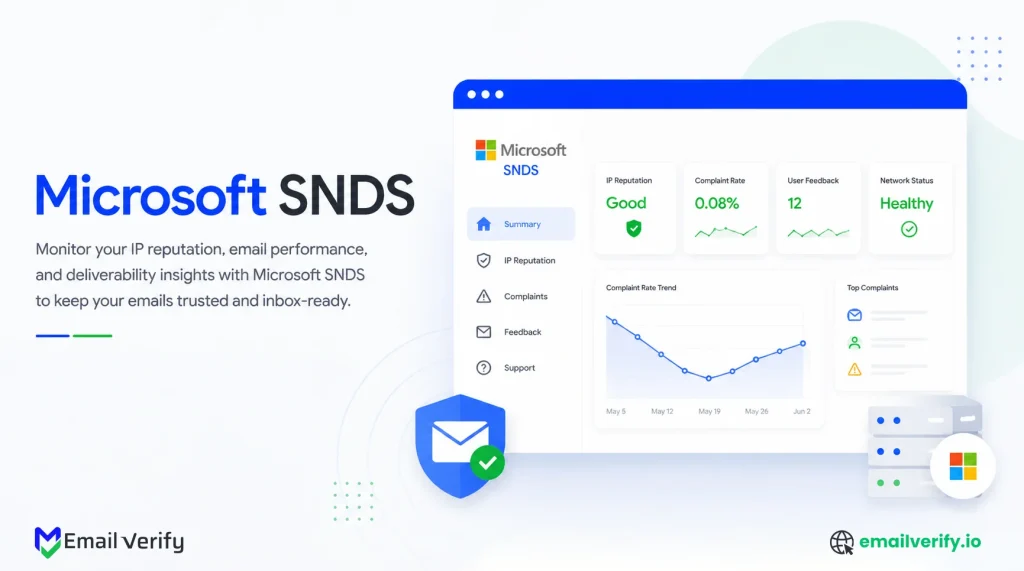
Microsoft SNDS (Smart Network Data Services) covers consumer Microsoft email domains, Outlook.com, Hotmail, Live.com, and MSN. It does not include Office 365 or Exchange Online business tenants, which is where many B2B senders get misled.
SNDS is IP-based, not domain-based. You verify individual sending IPs or IP ranges, and data becomes available within 24–48 hours after approval. You typically need around 100 emails/day to Microsoft consumer inboxes to generate meaningful data.
SNDS is structurally different from Gmail Postmaster Tools and Yahoo Sender Hub Insights in two important ways:
- It’s IP-based, not domain-based. You verify each sending IP, and data is reported per IP (or per IP range). If you’re on a shared IP (most Workspace and Microsoft 365 senders are), the data may not be cleanly attributable to your sending alone.
- It only covers consumer Microsoft domains. Office 365 corporate, Exchange Online business tenants, and Microsoft 365 Business plans are NOT covered by SNDS. This is the biggest practical limitation; most B2B audiences live on Office 365 corporate, where SNDS shows nothing.
Setup steps
- Go to sendersupport.olc.protection.outlook.com/snds and sign in with a Microsoft account.
- Submit your sending IP addresses or IP ranges for verification.
- Microsoft sends a verification email to the [email protected] address (or an alternative); confirm to verify.
- Wait 24–48 hours for data to populate.
If you don’t control your IP (shared ESPs), access may be limited. Some providers expose SNDS data through support dashboards instead.
SNDS does not reflect Office 365 business inboxes. If your audience is mostly B2B, SNDS only shows a partial view based on consumer Outlook traffic.
Reading Microsoft SNDS: Filter Result Color Codes
Filter Result is the most important single metric in SNDS, it’s Microsoft’s direct indicator of how SmartScreen sees your IP. But it’s also the most misunderstood, because the Yellow range is huge.
| Status | Range | What to do |
|---|---|---|
| ✓ OK | Green | Less than 10% of mail flagged as spam by SmartScreen. Healthy reputation. Continue current sending practices. |
| ⚠ Watch | Yellow | 10–90% flagged as spam. Wide range, could be barely above 10% or near 90%. Investigate complaint rate and trap hits to determine severity. If trending toward Red, reduce volume. |
| ✖ Act now | Red | More than 90% flagged as spam. Stop sending immediately. Audit list quality, suspend dormant subscribers, check for blacklist listings, and fix authentication. Recovery may take weeks. |
| Microsoft SNDS-Filter Result (example: healthy IP) | |
|---|---|
| Filter Result (last 24 hours) ● Green | Fewer than 10% of mail from this IP flagged as spam by SmartScreen. Healthy reputation. Continue normal sending. |
| Microsoft SNDS-Filter Result (example: warning) | |
| Filter Result (last 24 hours) ● Yellow | Between 10% and 90% of mail flagged. Range is wide; investigate the underlying complaint rate, trap hit count, and recent volume. Reduce volume if trending toward Red. |
Why Yellow is the most ambiguous signal
Yellow spans a massive range (10% to 90%), so interpretation depends on other signals:
- Complaint Rate rising: audience/content issue
- Trap Hits > 0: list quality problem (urgent)
- Volume spike + Yellow: warm-up or scaling issue
- No supporting issues: likely content filtering
Yellow should never be ignored; treat it as an early warning window before Red.
Reading Microsoft SNDS: Complaint Rate, Trap Hits, Volume
This section breaks down the three supporting signals in SNDS that explain why your Filter Result is Green, Yellow, or Red.
Complaint Rate
This is the single most-misread metric in SNDS, because most senders don’t realize how Microsoft displays the number. The actual behavior:
| Displayed value | What it actually means |
|---|---|
| 0.10% | Anything between 0% and 0.2% real complaint rate. Almost always healthy. |
| 0.20% | Real rate is above 0.2% but below 0.3%. Already a problem. |
| 0.30% | Real rate is above 0.3%. Severe problem. |
| 0.4% or higher | Severe — typically requires sending pause and investigation. |
In other words, 0.1% is the floor that always shows; anything above 0.1% is action-required. Most senders see 0.1% indefinitely with no issues; the moment it ticks up to 0.2%, that’s your signal that something has materially changed. This is different from Gmail’s spam rate, which shows continuous values.
Trap Hits
The Trap Hits column shows whether your IP has hit Microsoft-maintained spam traps. Healthy IPs always show zero trap hits. Any non-zero number requires immediate attention because:
- Trap hits indicate poor list quality, you’re sending to addresses you shouldn’t have.
- Trap hits accumulate quickly into reputation damage at Microsoft.
- Trap hits at high-priority blacklists (Spamhaus, etc.) can trigger cross-provider listings.
- Recovery from trap hits takes longer than recovery from complaint-driven reputation issues.
| Status | Range | What to do |
|---|---|---|
| ✓ OK | 0 | Healthy. No spam traps hit. Continue current list hygiene practices. |
| ✖ Act now | 1–50 | Spam traps detected. Run bulk verification on the recent recipient list immediately. Suspend dormant subscribers. Check for blacklist listings. |
| ✖ Act now | 50+ | Significant trap exposure. Pause sending immediately. List quality is materially compromised. Full verification audit and source review required. |
Volume (the consistency check)
The Volume column shows how many messages Microsoft processed from your IP during the reporting period. The number itself isn’t critical, the trend is. Sudden spikes (e.g., 5x normal) often trigger throttling and reputation shifts. If Volume rises while Filter Result moves from Green to Yellow, the increase likely caused filtering changes.
Microsoft counts each recipient separately (1 email to 10 users = 10 messages), so SNDS volume may be higher than your actual campaign sends.
If Yellow appears during a warm-up or scaling phase, slow your sending immediately. SNDS often shows reputation issues within 24–48 hours, earlier than Gmail Postmaster Tools, making it the best early warning signal during ramp-ups.
Yahoo Sender Hub Insights (The October 2025 Methodology Shift)
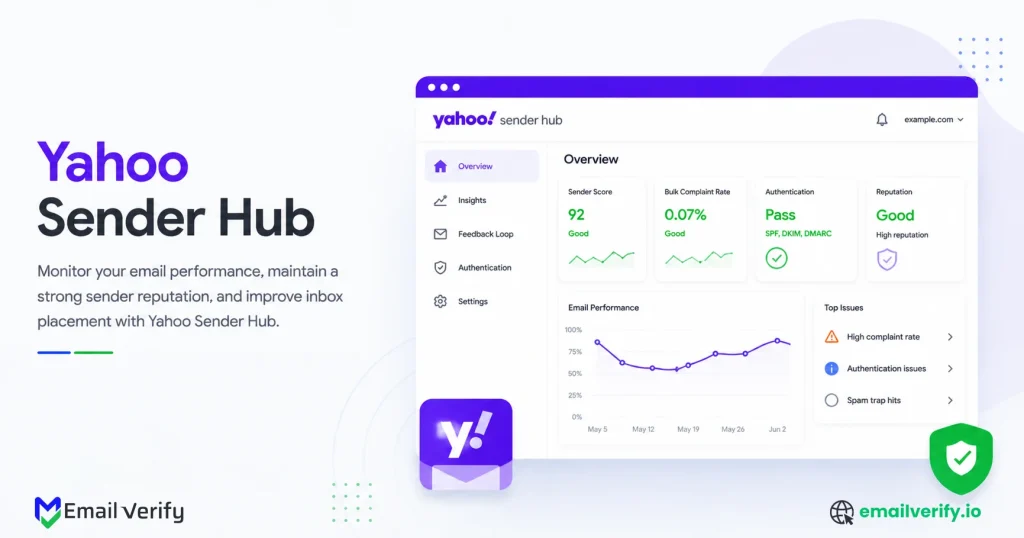
Yahoo Sender Hub Insights launched October 23, 2025, Yahoo’s answer to Gmail Postmaster Tools, with a notable methodology difference. Yahoo calculates spam complaint rate from inbox-delivered mail only, not total sent.
The reasoning: users can only complain about mail that reaches the inbox; calculating against inbox-delivered makes the rate reflect actual recipient sentiment. The result: Yahoo’s complaint rate numbers will look different (and arguably more accurate) than ESP-reported numbers calculated against total sent.
Most ESPs and most other postmaster tools calculate complaint rate as the number of complaints received divided by the total number of messages sent. Yahoo does it differently: complaints received divided by messages delivered to the inbox.
Yahoo does it differently: complaints received divided by messages delivered to the inbox. The denominator excludes mail that went to spam, was filtered before delivery, or was rejected entirely.
Practical implications:
Notice the divergence in damaged-sender scenarios. The worse your placement gets, the more the ESP-reported complaint rate understates what Yahoo actually sees.
| Scenario | ESP-reported complaint rate | Yahoo-reported complaint rate |
|---|---|---|
| Healthy sender, 90% inbox placement, 0.05% complaints from inbox-delivered. | 0.045% (90% of 0.05%) | 0.05% |
| Damaged sender, 50% inbox placement, 0.2% complaints from inbox-delivered. | 0.10% (50% of 0.2%) | 0.20% |
| Severe damage, 30% inbox placement, 0.5% complaints from inbox-delivered. | 0.15% (30% of 0.5%) | 0.50% |
Reading Yahoo Sender Hub Insights
Setup is similar to other postmaster tools. Verify your DKIM-signed domain in the Sender Hub, wait 24–48 hours for data to populate.
Verify your DKIM-signed domain in the Sender Hub, wait 24–48 hours for data to populate. Volume requirements are similar to Gmail; you need sustained sending to Yahoo addresses for the dashboard to show consistent data.
Most B2B senders won’t produce enough Yahoo volume; consumer-focused senders almost always will.
| Yahoo Sender Hub Insights — Spam Complaint Rate (example) | ||
|---|---|---|
| Complaint rate (last 7 days, inbox-delivered) 0.07% | Below 0.10% recommended threshold. Calculated against inbox-delivered mail only. Healthy. Continue current practices and watch trend. | |
Yahoo CFL: the most timely complaint signal available
Yahoo also operates a Complaint Feedback Loop (CFL) program separate from Sender Hub Insights. CFL forwards individual complaint reports directly to senders within hours of recipient action, the most timely complaint signal available for any major provider. Setup requires DKIM verification on your sending domain.
Once active, integrate the feedback into your suppression workflow so complainers stop receiving future mail immediately.
Gmail no longer offers an equivalent feedback loop (the legacy program was deprecated). Microsoft’s JMRP exists but is less timely. Yahoo CFL is the closest thing to real-time complaint reporting in 2026.
The Cross-Provider Reading Routine
Postmaster tools only deliver value if you actually read them. Here’s the rhythm that works for most teams:
| Frequency | What to check | Time investment |
|---|---|---|
| Daily (during active campaigns) | Gmail Compliance Status (30 sec). Spam Rate trend (30 sec). | 1 minute. |
| Daily (during recovery) | Add SNDS Filter Result and Complaint Rate to the daily check. | 3–5 minutes. |
| Weekly | Full review of all three providers. Spam Rate, authentication, encryption, trap hits, volume trends. | 15–20 minutes. |
| Monthly | Authentication audit. DMARC report review. Compliance status detail review. Audit any failing requirements. | 30–45 minutes. |
| Quarterly | Cross-provider reputation audit. Compare placement metrics across Gmail/Microsoft/Yahoo. Document trends. | 1 hour. |
| On any 4xx error rate spike | Investigate immediately. Check Spam Rate, Filter Result, recent campaigns and segments. | 30+ minutes ad hoc. |
This adds up to roughly 1–2 hours per week of disciplined attention. Teams that allocate that time consistently outperform teams that scramble to check tools only when something looks broken — every time. The early-warning signal in postmaster data is worth more than the post-hoc forensic value.
Weekly postmaster review checklist (15–20 min):
What’s Worth Ignoring (and What Isn’t)
Knowing what to ignore saves hours per week and prevents reactive over-management.
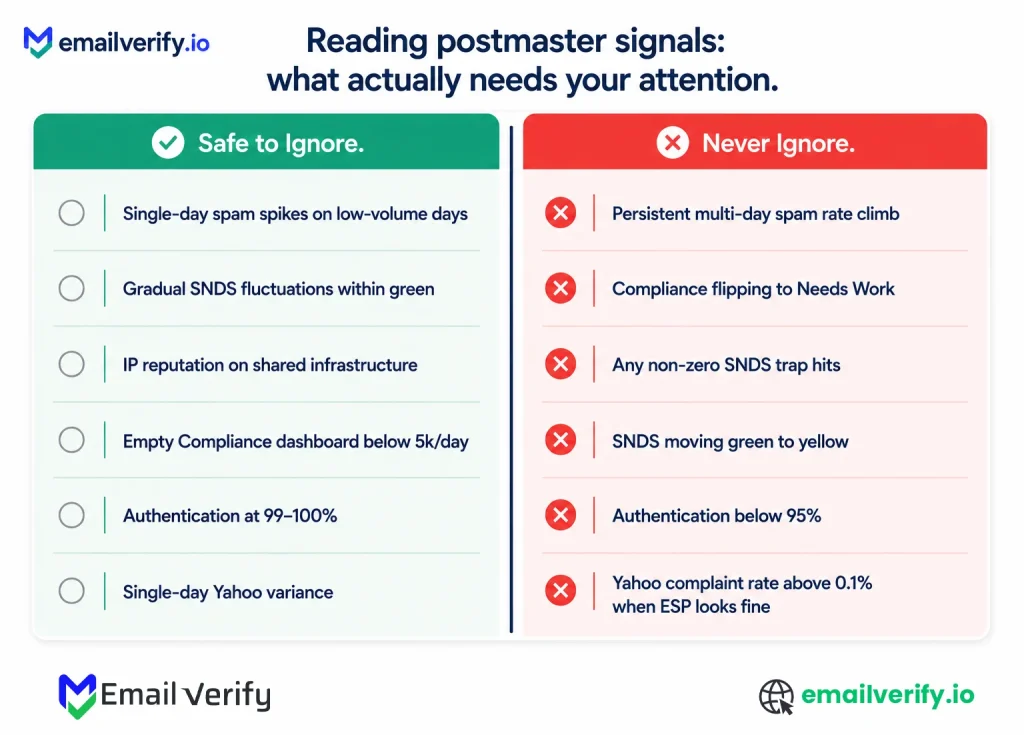
Safe to ignore
- Single-day spam rate spikes during low-volume periods.
- Gradual SNDS filter result fluctuations within green.
- IP-level reputation data when you’re on shared sending infrastructure (Workspace, Microsoft 365, ESP shared IPs).
- Empty the Compliance Status dashboard if you’re below 5,000/day to Gmail.
- Authentication pass rates of 99–100%.
- Single-day Yahoo Sender Hub variance during sub-threshold volume periods.
Don’t ignore
- Persistent multi-day spam rate climb, even within the recommended range.
- Compliance Status flipping from Pass to Needs Work.
- Any non-zero SNDS trap hits.
- SNDS filter result moving from green to yellow.
- Authentication pass rate dropping below 95% for any of SPF/DKIM/DMARC.
- Yahoo complaint rate above 0.1%, especially if your ESP-reported rate looks fine.
Don’t treat postmaster data as a real-time control system. Reacting to every single-day fluctuation produces over-management and burnout. Build the weekly rhythm and trust the trend, not the daily snapshot.
How Does Verification Improve Every Postmaster Metric?
Email verification operates upstream of every postmaster tool. Gmail, Microsoft, and Yahoo don’t create deliverability issues; they reveal them. In most cases, those issues start with poor list quality.
Hard bounces from invalid addresses directly distort Gmail’s spam rate, Microsoft SNDS filter results, and Yahoo complaint rates. Spam traps appear as reputation damage across providers.
Three verification layers that are compounded:
- Real-time verification at signup forms: Catches typos, disposable email addresses, and obvious junk before they enter your database. Use the EmailVerify.io API.
- Bulk verification on imported lists: Run before any third-party list goes into your active sending stream. Typical result: 20–30% of any imported list comes back as bad data.
- Quarterly bulk re-verification: B2B addresses decay at roughly 2.1% per month; B2C is slower but still meaningful.
The postmaster-tools-plus-verification combination is the cheapest, highest-leverage deliverability infrastructure available. Together they catch most reputation problems before they cause customer-visible deliverability issues.
Frequently Asked Questions
How Do You Read Gmail Postmaster Tools V2?
Start with the Compliance Status dashboard, it’s the main Pass / Needs Work signal. Then check Spam Rate (target below 0.10%, alert above 0.30%). Review Authentication pass rates (should be 99%+ for SPF, DKIM, and DMARC), then Encryption (should be 100% in 2026). Use Delivery Errors and Feedback Loop dashboards when diagnosing issues. Sections 5–8 of this guide explain each in detail.
What Is The Difference Between Postmaster Tools V1 And V2?
Google retired v1 between September 30 and October 31, 2025. The key change in v2 is the removal of Domain Reputation and IP Reputation dashboards (the four-tier Bad/Low/Medium/High system). These are replaced by the Compliance Status dashboard, which uses a binary Pass / Needs Work model. Core metrics like Spam Rate, Authentication, Encryption, Delivery Errors, and Feedback Loop remain with refinements.
What Is Microsoft SNDS?
Microsoft Smart Network Data Services (SNDS) is Microsoft’s postmaster tool for consumer domains like Outlook.com, Hotmail, Live.com, and MSN. It operates at the IP level and shows Filter Result (Green/Yellow/Red), Complaint Rate, Spam Trap Hits, and Volume. It does not cover Office 365 business tenants or Exchange Online, which is a key limitation for B2B senders.
What Does A Yellow Filter Result In SNDS Mean?
Yellow means Microsoft SmartScreen has flagged 10%–90% of mail from your IP as spam. The range is wide, so severity can vary. To understand impact, check Complaint Rate, Trap Hits, and Volume. Most teams treat Yellow as a warning state requiring action within 1–3 days before it escalates to Red.
Why Does Microsoft SNDS Only Show 0.1% For My Complaint Rate?
SNDS displays complaint rate in rounded tenths of a percent. The 0.1% value actually represents anything between 0% and ~0.2% real complaint rate. If it moves to 0.2% or higher, your actual rate has crossed a serious threshold. Anything above 0.1% should be investigated.
What Is Yahoo Sender Hub Insights?
Yahoo Sender Hub Insights is Yahoo’s postmaster tool launched on October 23, 2025. It provides domain-level delivery data like spam complaint rate, authentication, reputation signals, and volume trends. Its key difference is methodology, Yahoo calculates complaint rate based only on inbox-delivered mail, not total sent, making it more reflective of actual user experience.
How Often Should You Check Postmaster Tools?
For active sending, check Gmail Compliance Status and Spam Rate daily (under 1 minute). During issues, also monitor SNDS daily. Do a full cross-provider review weekly (15–20 minutes), monthly authentication checks, and quarterly reputation audits. Most teams need about 1–2 hours per week total.
How Long Does It Take For Postmaster Data To Update?
Most metrics update within 24–48 hours. Gmail Spam Rate uses rolling averages, so major changes take 5–7 days to fully reflect. SNDS updates daily. Yahoo updates within 24–48 hours once volume thresholds are met. Gmail Compliance Status can take up to a week to reflect fixes.
What Is A Good Gmail Spam Rate?
Below 0.10% is the recommended threshold. Above 0.30% is a policy violation. Best practice is staying below 0.05% consistently. Between 0.10% and 0.30% is a warning zone requiring investigation. Above 0.30%, Gmail may actively filter or reject mail.
How Do You Access SNDS Data On A Shared IP?
If you don’t control your sending IP, direct SNDS access may not be available. Some ESPs (like SendGrid) provide aggregated SNDS data through their support or dashboards. For Google Workspace or Microsoft 365 shared infrastructure, SNDS visibility is often limited or unavailable.
Should You Monitor Postmaster Tools For Cold Email?
Yes. Cold email benefits even more from early-warning signals. Monitor Gmail and Microsoft daily during active campaigns. Ensure you meet minimum volume thresholds (around 100/day) or dashboards may not populate. Many cold email teams also segment sending domains to maintain usable postmaster visibility.
How Do Postmaster Tools Compare To Seed List Testing?
Postmaster tools show real provider-side data (first-party and authoritative). Seed tests simulate inbox placement using test addresses. Postmasters are more accurate for reputation; seed tests are better for campaign-level inbox previews. The strongest setup uses both together for monitoring and testing.
Final Thoughts
Postmaster tools are the most direct source of truth in email deliverability because they come from Gmail, Microsoft, and Yahoo themselves. Everything else in the stack is interpretive; these signals reflect what is actually happening at mailbox level.
The real difficulty is reading it correctly in context. Metrics like Gmail spam rate, SNDS filter result, or Yahoo complaint rate rarely explain problems on their own. They only make sense when viewed alongside sending behavior, list quality, and authentication consistency.
Most issues visible in these dashboards don’t start there, they surface there. By the time a warning appears, the underlying cause has usually been building in your sending system for some time.
This is why postmaster tools work best as a connected system rather than isolated reports. Gmail reflects compliance and engagement thresholds, Microsoft reflects IP-level filtering behavior, and Yahoo reflects inbox-delivered user sentiment. Together, they give a complete but still outcome-based view of sender health.
Used correctly, these tools show what is going wrong and help you confirm whether your sending foundation is stable or starting to drift.
Screen your list with EmailVerify.io or integrate real-time verification at capture now.


