Sender Score is one of the most widely used reputation metrics in email deliverability: a 0–100 rating designed to reflect the reputation of a sending IP address. Its simplicity makes it useful for monitoring trends and communicating reputation health internally. It also makes the metric easy to misunderstand.
A strong Sender Score often correlates with healthy inbox placement, while lower scores can indicate reputation issues that affect deliverability. However, mailbox providers such as Gmail, Microsoft, and Yahoo do not directly use Validity’s Sender Score when making filtering or routing decisions. Each provider relies on its own first-party reputation systems and engagement data.
That distinction is important.
This guide explains what Sender Score actually measures, where it meaningfully correlates with deliverability outcomes, where the correlation becomes unreliable, and which complementary signals should be monitored alongside it, including Gmail Postmaster Tools, Microsoft SNDS, complaint rates, reply rates, authentication health, and engagement metrics.
Sender Score is a useful reputation indicator, but it is not a standalone measure of deliverability health. Used correctly, it provides valuable trend visibility. Used in isolation, it can create misleading conclusions about actual inbox placement.
This is the article to read once before you start using Sender Score and to come back to whenever you’re tempted to treat the number as the truth.
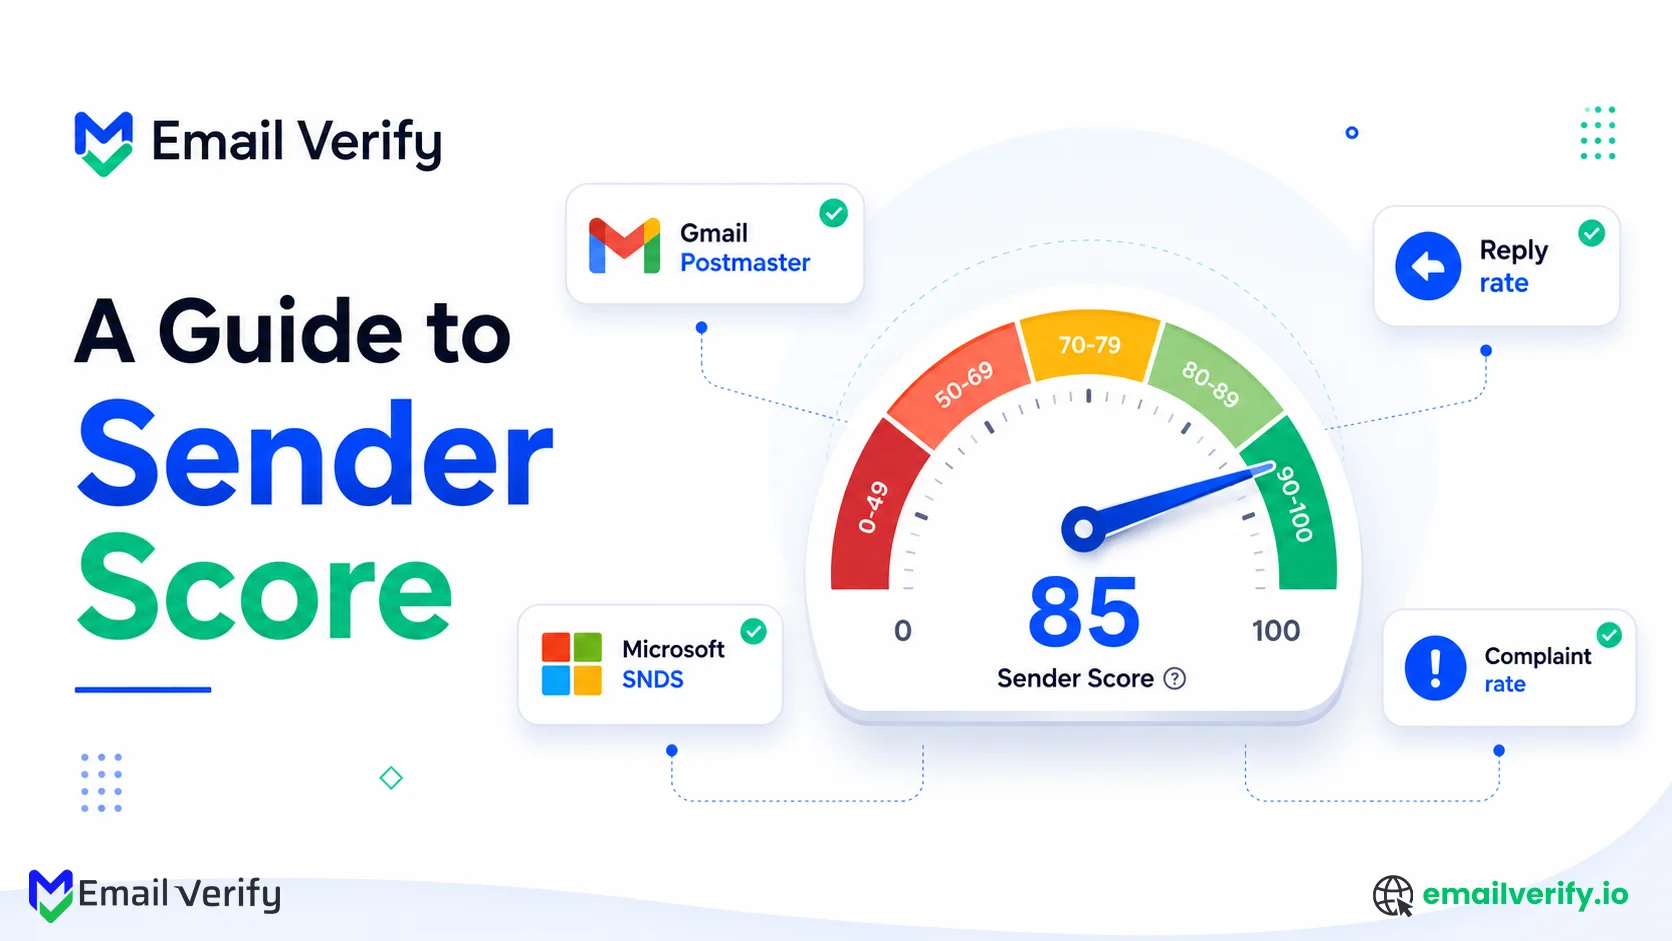
Sender Score is a 0–100 reputation rating for an email-sending IP address, calculated by Validity using a rolling 30-day view of complaint rates, spam trap hits, sending volume, and engagement signals from its data network.
Score bands:
- 90–100: Excellent (strong inbox placement)
- 80–89: Good (stable performance)
- 70–79: Moderate (monitor closely)
- Below 70: Risk zone (deliverability issues likely)
It correlates with deliverability mainly for dedicated IPs with stable sending patterns. It becomes less reliable for shared IPs, low-volume senders, and B2B traffic-heavy environments.
Sender Score is not used by mailbox providers in filtering decisions. It is a third-party reputation indicator, best used for trend monitoring, not as a standalone measure of inbox placement.
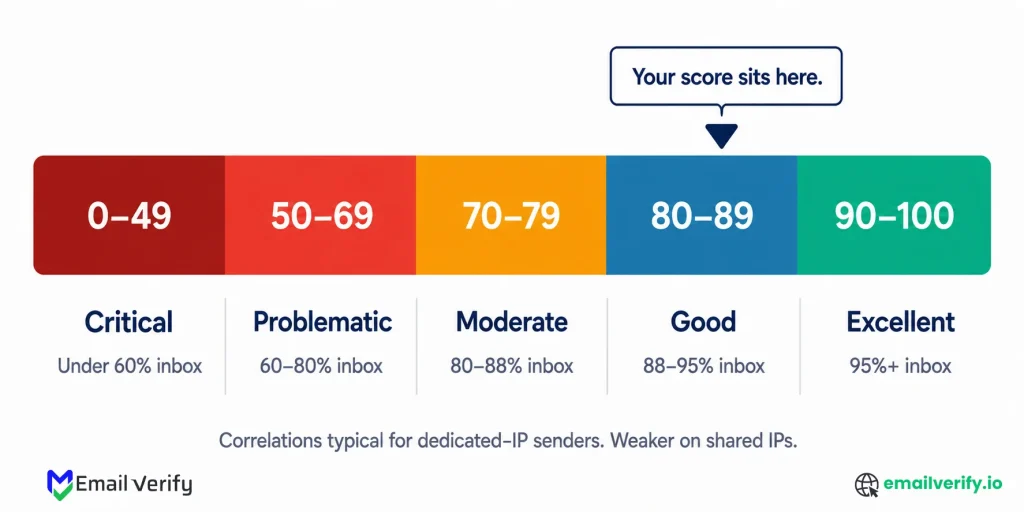
Table of Contents
What Is Actually a Sender Score?
Sender Score is a reputation metric developed by Validity that evaluates the trustworthiness of an email-sending IP based on observed sending behavior across a wide network of mailbox providers and security systems.
It is calculated using a rolling 30-day view of signals such as complaint rates, spam trap hits, sending volume patterns, external reputation data, and filtering behavior collected through the Validity Data Network, which aggregates insights from 80+ providers and security partners.
The exact formula is proprietary. Validity publishes individual contributing components, but not their weighting, which makes Sender Score more useful for identifying reputation trends than for precise diagnostic breakdowns.
The basic facts most senders don’t know:
| Fact | Detail |
|---|---|
| Owned by | Validity (acquired Return Path in 2018-2019). Originally launched by Return Path in 2005. |
| Scale | 0-100. Higher is better. Functions as a percentile ranking against tracked sending IPs. |
| Calculated on | Sending IP address (primarily). Domain-level data is also available via Validity’s paid products. |
| Update frequency | Rolling 30-day average. Daily refresh. |
| Data source | Validity Data Network, 80+ mailbox and message security providers contributing data. |
| Cost | Free for individual IP lookups at senderscore.org. Paid integrations available via Validity Everest. |
| Used by mailbox providers? | No. Providers don’t consult Sender Score when routing mail. The score reflects ecosystem signals; routing decisions use first-party data. |
That last row is the most important one for understanding what Sender Score is and isn’t. Mailbox providers, Gmail, Microsoft, Yahoo, and Apple, do not consult Validity’s Sender Score when deciding where to route your mail. Each provider uses its own first-party reputation calculation based on its own data.
Sender Score is downstream of provider decisions, not upstream of them. The score moves because providers and message security agencies in Validity’s data network observed your sending behavior and reported it to Validity.
Your score reflects those observations; it doesn’t cause them. “Improving Sender Score” means improving the underlying behavior that drives the score. The score will follow.
6 Important Limits of Sender Score in Email Deliverability

Sender Score is useful within its limits. The limits matter. Six things every sender should understand before treating the number as authoritative:
1. It is a single-vendor reputation model
Sender Score is owned by Validity and built on its proprietary data network. There is no industry-wide standard behind it, and other systems like Microsoft or Cisco use different reputation signals. This makes it one perspective, not a universal benchmark.
2. The scoring logic is not transparent
Validity shares the main factors like complaints, volume, external reputation, and filtering behavior, but not their exact weighting. Because of this, Sender Score should be treated as a directional metric rather than a fully explainable score.
3. It is IP-focused, not domain-aware
Sender Score evaluates IP addresses, not domains. In shared environments like Google Workspace or Microsoft 365, your score may reflect other senders on the same IP. This can create gaps between score and real inbox performance.
4. It operates on a delayed rolling window
The score uses a 30-day rolling average, so changes appear slowly. Improvements or issues may take weeks to reflect, making it better for trend analysis than real-time decisions.
5. It requires sufficient sending volume
Sender Score is more accurate at higher volumes, typically several thousand emails per day. Low-volume senders may see unstable or less reliable scores due to limited data.
6. It does not reflect mailbox provider decisions
Gmail, Microsoft, and Yahoo do not use Sender Score for filtering. They rely on their own internal reputation and engagement data. This is why Sender Score can differ from actual inbox placement.
Sender Score Bands Explained: What 0–100 Actually Means
Sender Score uses a 0–100 scale that reflects how an IP’s reputation compares to other sending IPs in the Validity network. Higher scores generally indicate stronger sending behavior and better inbox placement trends, though the score is best interpreted as a relative benchmark rather than a guarantee of deliverability.
Sender Score Bands at a Glance:
| Score | Band | What it means and what to do |
|---|---|---|
| 90-100 | Excellent | Top decile of senders. Typical inbox placement: 95%+. No action needed; maintain current practices. |
| 80-89 | Good | Healthy reputation. Typical inbox placement: 88–95%. Periodic review; address any trend declines. |
| 70-79 | Moderate | Watch zone. Typical inbox placement: 80–88%. Investigate component scores; address whichever is lowest. |
| 50-69 | Problematic | Material reputation issues. Typical inbox placement: 60–80%. Active recovery required: list audit, complaint rate fix, authentication review. |
| 0-49 | Critical | Severe reputation damage. Typical inbox placement: under 60%, often near 0% at some providers. Pause sending, audit list, expect 4-12 week recovery. |
Two important caveats about the bands:
- The inbox-placement correlations are typical for dedicated-IP senders. For shared-IP senders, both directions of the correlation are weaker; a 90 doesn’t guarantee 95% placement, and a 60 doesn’t necessarily mean 80% placement is impossible.
- Daily score variation within a band is normal. Don’t panic over a single-day move from 87 to 84; that’s noise within the rolling-average calculation. A sustained trend dropping from 87 to 78 over a week is a real signal.
For accurate interpretation, track Sender Score alongside a 7-day moving average. This helps filter out daily noise and highlights real reputation shifts caused by changes in list quality, engagement, or sending behavior.
What Are the 5 Components of Sender Score?
Sender Score is built from a set of core reputation signals that reflect how an IP performs across different aspects of email sending behavior. These components are derived from the Validity Data Network and work together to form the overall score, although their exact weighting is not publicly disclosed.
To understand how Sender Score is built, it helps to break down its five core components
| Component | What it measures | How to address |
|---|---|---|
| Complaints | Your IP’s complaint rate compared to all other tracked IPs in the Validity Data Network. Calculated as complaints divided by accepted mail. | Reduce complaint rate: better segmentation, easier unsubscribe, and avoid sending to disengaged subscribers. |
| Volume | Sending volume relative to peers and your historical pattern. Sudden volume spikes or drops affect this index. | Maintain consistent sending volume; ramp gradually; avoid sudden bursts. |
| External Reputation | How blocklist operators (Spamhaus, etc.) and other external reputation services rate your IP. | Stay off blocklists. Address any listings immediately. Maintain clean list hygiene. |
| Filter Performance | How often filtering vendors (anti-spam services, security agencies) flag your mail as suspicious. | Improve content quality. Ensure proper authentication. Avoid spam-trigger patterns. |
| Additional signals | Engagement, authentication results, content patterns, and other proprietary signals. | Improve engagement; ensure SPF/DKIM/DMARC alignment; maintain content quality. |
Why the Weights Stay Hidden
The weighting behind these components is intentionally undisclosed. Validity avoids publishing it to prevent senders from gaming the system by optimizing only one factor instead of improving overall behavior.
Don’t try to reverse-engineer Sender Score component weights to find shortcuts. Some senders look at their component scores and try to figure out which one carries the most weight, then optimize only that.
This rarely works because the weights are proprietary and the components are correlated; fixing complaints often fixes Filter Performance because the underlying causes overlap.
How Does Sender Score Relate to Email Deliverability?
Sender Score isn’t random or meaningless; it correlates with email deliverability for the senders it’s designed to measure. The correlation works best in this profile:
- Dedicated IP. The IP’s reputation reflects only your sending. No contamination from other senders.
- Consistent volume of 5,000+/day. Enough data for the rolling average to be statistically meaningful.
- Established history of 3+ months. The 30-day average has time to reflect actual behavior, not just initial warm-up.
- Consumer-heavy audience: Gmail, Yahoo, and consumer Outlook, where Validity’s data network has the strongest provider participation.
- Stable sending pattern. No major spikes, no sudden segment changes, no rapid volume ramps.
Under these conditions, Sender Score tracks reality reasonably well.
A trend from 90 to 80 over two weeks is meaningful and signals real reputation drift. A sustained 95 across multiple weeks indicates an excellent reputation.
A score below 70 sustained for several weeks does indicate material problems. The correlation justifies including Sender Score in your monitoring stack.
Where the Correlation Between Sender Score and Deliverability Breaks Down
Sender Score becomes less reliable when the underlying data model no longer matches how mailbox providers actually evaluate reputation. The following are the five scenarios where the score misleads:
Scenario 1: Shared-IP Senders
In shared IP setups (such as Google Workspace, Microsoft 365, or ESP shared pools), Sender Score reflects the behavior of all senders on the IP. mailbox providers evaluate domain-level behavior, so Sender Score often becomes secondary in these environments.
Scenario 2: Low-Volume Senders
Sender Score relies on a 30-day rolling dataset. When volume is low (typically under ~1,000 emails/day), a single complaint or small campaign can cause large swings, making the score statistically unreliable.
Scenario 3: B2B Audiences on Office 365
Validity’s data network has stronger coverage of consumer inboxes and weaker visibility into corporate Microsoft 365 environments. For B2B senders, this creates a blind spot; the score may look stable while Office 365 deliverability is declining.
Scenario 4: Rapid behavioral change
During warm-ups or list changes, Sender Score lags behind real behavior by 1–2 weeks. This delay can temporarily understate improvements or overstate past performance.
Scenario 5: Provider-specific reputation issues
If an issue is isolated to a single mailbox provider, the overall score may not reflect it immediately. First-party tools like Gmail Postmaster Tools or Microsoft SNDS detect these issues much faster.
The Sender Score is most reliable in stable, high-volume, dedicated-IP environments. Outside of that context, especially in shared IP setups, low-volume sending, or B2B-heavy traffic, it should be treated as a secondary signal rather than a primary deliverability indicator.
The Shared-IP Problem in Sender Score
Most senders in 2026 operate on shared IP infrastructure rather than dedicated IPs. On shared IPs, your Sender Score reflects the combined behavior of all senders using that IP, not just your own activity. mailbox providers evaluate reputation primarily at the domain level, not the shared IP level.
How shared IP scoring actually works:
- Your email platform routes messages through a shared IP pool.
- Validity assigns a Sender Score to that IP based on aggregated behavior.
- Every sender on that IP contributes to the same reputation score.
This creates a mismatch between Sender Score and real deliverability performance in shared environments.
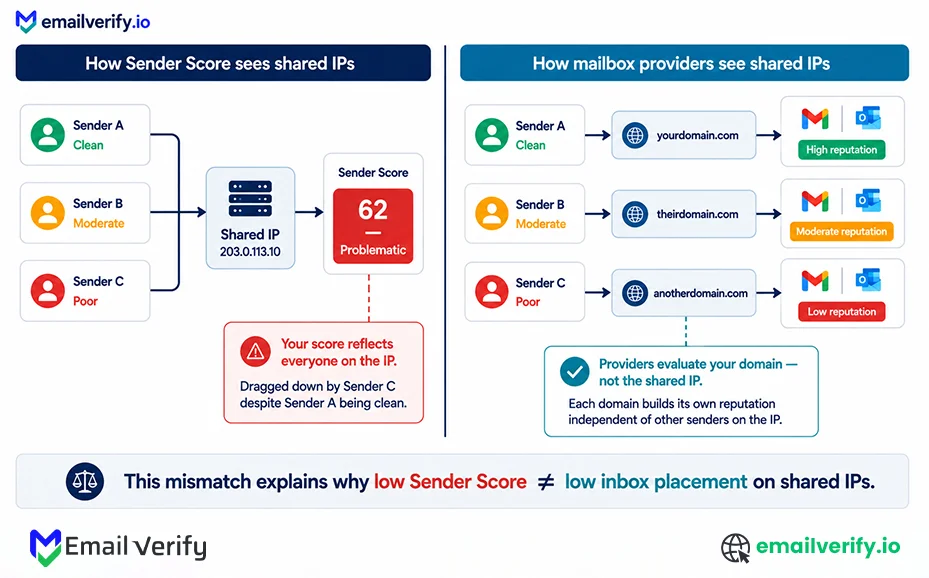
Why this leads to misleading signals
A clean sender can appear to have a low Sender Score due to unrelated activity from other tenants on the same IP. At the same time, a poor sender may appear healthier than expected if the IP pool overall is well maintained.
Mailbox providers such as Gmail and Microsoft are aware of shared infrastructure and prioritize domain-level reputation over IP-level aggregation, which is why inbox placement often remains stable even when Sender Score looks weak.
How to tell if shared IP is affecting your score
| Signal | What it indicates | |
|---|---|---|
| Using Google Workspace, Microsoft 365, or shared ESP IPs | You are on shared infrastructure | |
| Sender Score fluctuates without sending changes | Other senders are influencing the IP | |
| Low Sender Score but strong Gmail placement | Domain reputation is healthy; IP score is contaminated | |
| Multiple IPs show different scores | Each shared pool has separate reputation behavior | |
| Sudden drops without campaign changes | External senders on the same IP likely caused it |
What to do if you’re on a shared IP
Three options, in order of practicality:
- Prioritize domain-level reputation tools: Use Gmail Postmaster Tools, Microsoft SNDS, and Yahoo Sender Hub as your primary signals. These reflect how mailbox providers actually evaluate your sending.
- Treat Sender Score as directional only: On shared IPs, use it for trend awareness, not decision-making. It can still indicate changes in the broader IP pool, but not your individual performance.
- Move to a dedicated IP when volume supports it: Dedicated IPs are only effective at scale (typically 30,000+ emails/month). Below that, shared IPs often perform better due to stronger collective reputation signals.
One of the most common errors is overreacting to a low Sender Score on shared infrastructure. For example, a score of 30–40 may trigger concern, while actual Gmail placement remains above 90% inbox because domain-level reputation is strong.
Always validate against first-party tools before taking action.
Sender Score vs. Postmaster Tools: The Honest Comparison
Sender Score and Postmaster Tools are often grouped together in email deliverability discussions, but they operate on fundamentally different data models. Postmaster Tools from Gmail, Microsoft SNDS, and Yahoo Sender Hub provide first-party insights directly from mailbox providers, meaning they reflect how your email is actually being processed at each platform.
Sender Score, on the other hand, is a third-party reputation metric from Validity that aggregates signals across its data network to estimate IP reputation at an ecosystem level.
This is the comparison most senders need but rarely see done honestly. Both tools are useful; they’re not interchangeable.
| Question | Sender Score | Postmaster Tools |
|---|---|---|
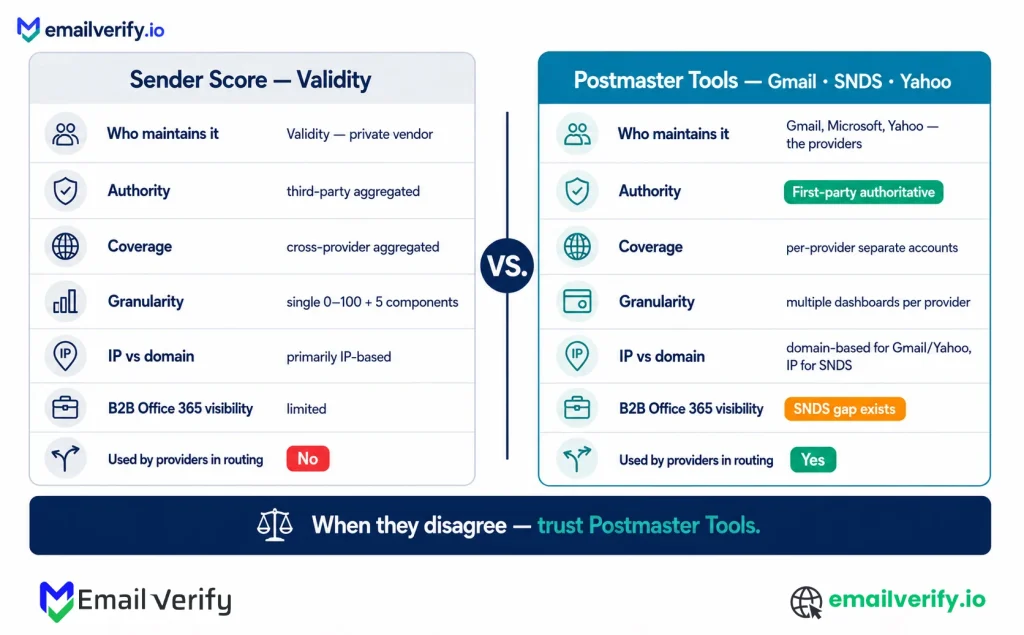
| Who maintains it? | Validity (private vendor). | Gmail, Microsoft, Yahoo (the providers themselves). |
| Authority level | Third-party aggregated reputation. | First-party authoritative data. |
| Cost | Free for individual lookups. | Free. |
| Coverage | Cross-provider aggregated view. | Per-provider; need separate accounts for each. |
| Granularity | Single 0-100 number plus 5 components. | Multiple dashboards per provider with detailed metrics. |
| Update frequency | Rolling 30-day average; daily refresh. | Daily updates, 24–48 hour lag. |
| IP vs domain | Primarily IP-based. | Primarily domain-based (Gmail, Yahoo), SNDS is IP-based. |
| B2B Office 365 visibility | Limited, weak data network coverage of corporate Office 365. | Microsoft SNDS doesn’t cover Office 365 either; a gap exists at both. |
| Used by mailbox providers in routing decisions? | No. | Yes, these are the data providers actually use. |
When is sender score more useful?
Sender Score is best used for high-level visibility rather than operational decision-making. It provides a single, simplified view of reputation trends across multiple providers, which makes it useful for executive reporting, quick health checks, and early-stage monitoring before full Postmaster setup is in place.
It is most effective when used as a directional signal rather than a diagnostic tool.
When are Postmaster Tools most useful?
Postmaster Tools are designed for operational deliverability control. They help identify exactly how individual providers are treating your emails and are essential for diagnosing issues such as spam placement, reputation drops, or campaign-level changes.
They are especially important for tracking Gmail, Microsoft, and Yahoo performance independently, since each provider applies its own filtering logic based on first-party data.
When Postmaster data and Sender Score diverge, Postmaster Tools should be considered the more accurate reflection of deliverability status.
The Complementary Signals You Actually Need
Sender Score and Postmaster Tools are core indicators, but they don’t give the full deliverability picture on their own. To properly understand email reputation, you need a broader set of signals that reflect provider behavior, engagement quality, list health, and authentication performance.
| Signal | What it shows | Where to check |
|---|---|---|
| Per-provider complaint rate | Early reputation issues at Gmail, Microsoft, Yahoo | Postmaster Tools, Yahoo CFL, Microsoft feedback loops |
| Reply rate | Real engagement strength (high-value signal for Gmail) | ESP reporting |
| Hard vs soft bounces | List quality vs temporary delivery issues | ESP bounce logs |
| SPF, DKIM, DMARC pass rate | Authentication health and alignment issues | Postmaster Tools, DMARC reports |
| Engagement velocity | How fast users interact after delivery | ESP analytics |
| SMTP error ratio (4xx vs 5xx) | Throttling vs blocking behavior | Server logs / ESP reports |
| Seed inbox placement | Actual inbox vs spam placement | Tools like GlockApps or InboxAlly |
Why reply rate matters most
Reply rate is one of the strongest but least tracked signals in email deliverability. Unlike opens or clicks, it reflects intentional user engagement. Gmail in particular uses replies as a strong trust indicator because they are difficult to fake or inflate.
This makes reply rate especially important for cold outreach and B2B email, where opens are unreliable and clicks are often minimal. A declining reply rate is often an early warning sign of weakening sender reputation or audience mismatch.
Build a single deliverability dashboard combining Sender Score, per-provider Postmaster Tools metrics, complaint rate, reply rate, hard bounce rate, and authentication pass rate. The discipline of looking at all signals together is what catches problems any single signal misses.
How to Check Your Sender Score
Checking your Sender Score takes under a minute. The free tool is at senderscore.org.
- Go to senderscore.org and click “Get your score.”
- Enter an IP address or sending domain.
- View your score and the five component indices.
- Review the trend chart over time.
How Can You Improve Your Sender Score?
Improving Sender Score is not a separate process from improving email deliverability. The score only reflects underlying sending behavior, so any meaningful improvement comes from fixing reputation drivers like bounces, complaints, authentication, and sending consistency. Most changes take 2–4 weeks to appear because of the 30-day rolling average.
Following are the ways you can adopt to improve your sender score:
Improving Sender Score only reflects underlying sending behavior. Most changes take 2–4 weeks to appear because of the 30-day rolling average. Ways to improve your sender score:
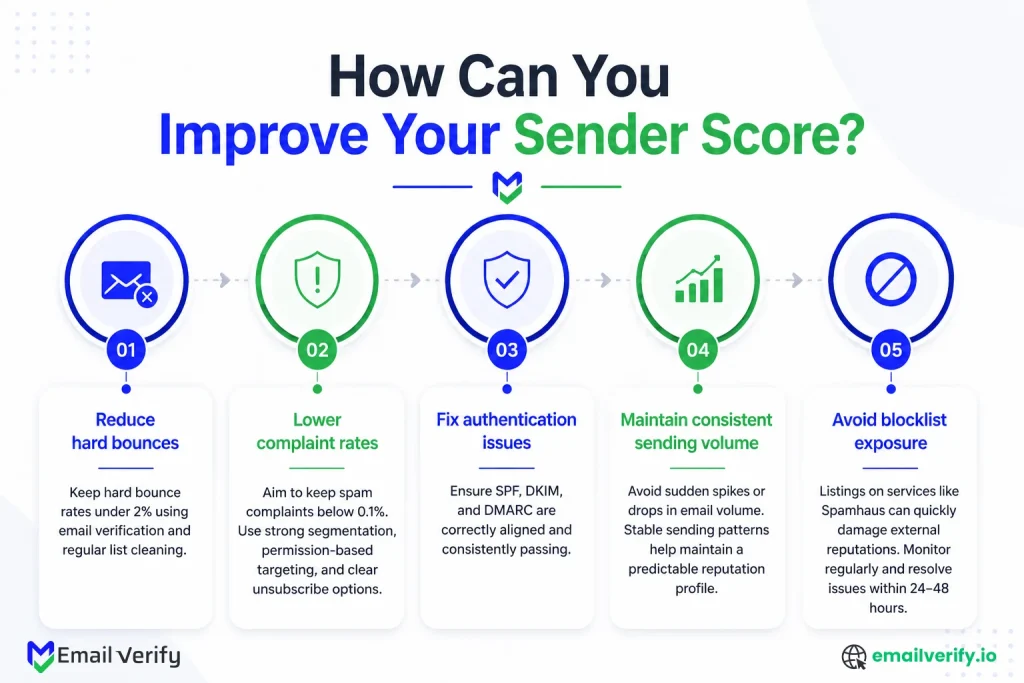
Reduce hard bounces
Keep hard bounce rates under 2% using email verification and regular list cleaning. High bounce rates signal poor list quality and directly damage reputation.
Lower complaint rates
Aim to keep spam complaints below 0.1%. Strong segmentation, preference-based targeting, and clear unsubscribe options are critical here.
Fix authentication issues
Ensure SPF, DKIM, and DMARC are correctly aligned and consistently passing. Authentication failures negatively affect multiple score components.
Maintain consistent sending volume
Avoid sudden spikes or drops in email volume. Stable sending patterns help maintain a predictable reputation profile.
Avoid blocklist exposure
Listings on services like Spamhaus can quickly damage external reputations. Monitor regularly and resolve issues within 24–48 hours.
Why improvements take time
Sender Score is based on a 30-day rolling average, so it reflects historical behavior more than real-time changes. Even after fixing issues, the score typically takes 2–4 weeks to fully adjust. Severe reputation problems may take longer to recover.
This lag is why proactive monitoring matters more than reactive fixes. If you only respond after the score drops, the underlying issue has already impacted the reputation for weeks.
Avoid services that promise instant Sender Score increases through artificial engagement or “warm-up farms.” Mailbox providers evaluate authentic engagement signals, and artificial manipulation typically collapses once the activity stops.
Understanding HubSpot Sender Score
There are two things called “Sender Score” in 2026, and they’re completely different.
- The Validity Sender Score is the industry IP reputation rating covered throughout this article (0-100 scale, calculated by Validity, IP-based).
- HubSpot Sequences Sender Score is HubSpot’s internal quality score for sequence-based outbound (calculated using sequence reply rate and bounce rate, requires 100+ ended sequence enrollments).
They have nothing to do with each other beyond the name.
This catches some users by surprise: a HubSpot customer searches “Sender Score” in HubSpot Help and finds documentation about a metric specific to HubSpot Sequences, then assumes it’s the same as the validity score they’ve heard about elsewhere. It isn’t.
| Validity Sender Score | HubSpot Sequences Sender Score | |
|---|---|---|
| What it measures | IP reputation across the broader email ecosystem. | Quality of HubSpot sequence-based outbound. |
| Calculation | Rolling 30-day average from Validity Data Network. | Sequence reply rate and bounce rate within HubSpot. |
| Scale | 0-100. | Numerical score within HubSpot UI. |
| Where to check | senderscore.org. | Inside HubSpot Sales Hub or Service Hub. |
| Who can use it | Anyone with an IP address. | HubSpot Sales Hub Professional/Enterprise or Service Hub Professional/Enterprise users. |
| Volume requirement | Sustained 1,000+/day for accuracy. | 100+ ended sequence enrollments. |
| Useful for | External email reputation. | Internal sales sequence quality monitoring. |
Both metrics are useful within their domains, but they answer completely different questions.
If you’re looking for the industry-standard reputation measure, you want Validity Sender Score. If you’re looking at HubSpot Sequences’ performance specifically, you want HubSpot’s metric.
The naming overlap is a marketing artifact; HubSpot adopted the term for their internal feature without changing the meaning of the existing industry term.
If you’re reading documentation that mentions “Sender Score” and the context is HubSpot Sequences, that’s the HubSpot internal metric. If the context is general email deliverability, IP reputation, blocklists, or the senderscore.org URL, that’s the validity metric. The two are unrelated; don’t conflate strategies for one with the other.
Common Mistakes That Can Hurt Sender Score
Sender Score is helpful, but it’s also one of the most commonly misunderstood email reputation metrics. Most issues don’t come from the score itself, but from how it’s interpreted in isolation or reacted to too quickly. When used without context, it can lead to unnecessary fixes or missed real deliverability problems.
The mistakes below are the ones that most often distort how teams read and act on Sender Score data.
Treating the score as the truth
Sender Score is one signal among many. Treating it as the headline metric, or worse, as ground truth, leads to overreaction in shared-IP scenarios and under-reaction to per-provider problems. Use it as a single integration-friendly number for executive reporting, but never as the operational decision input.
Panicking over single-day score changes
Sender Score uses a 30-day rolling average; daily values smooth out small variations. A move from 87 to 84 in a single day is noise within the calculation, not a meaningful signal. A sustained trend from 87 to 78 over a week is the action signal. Track 7-day moving averages to filter remaining noise.
Ignoring shared-IP contamination
Most senders are on shared IPs but treat their Sender Score as if it reflected their behavior alone. Shared-IP scores are aggregated across all senders on the IP; your individual behavior contributes but doesn’t solely determine the score. If you’re on shared infrastructure (Workspace, Microsoft 365, or ESP shared pools), trust domain-level signals (Postmaster Tools) over IP-level Sender Score.
Optimizing component scores in isolation
Sender Score components (Complaints, Volume, External Reputation, Filter Performance, plus additional) are correlated. Fixing complaints often fixes Filter performance because the underlying causes overlap. Trying to optimize a single component while ignoring others rarely produces durable improvement; the score may rise temporarily, but the gain doesn’t hold without addressing underlying behavior holistically.
Buying “sender score improvement” services
Services that promise to improve Sender Score by sending to engagement-farm addresses or buying favorable signals from data network partners don’t produce real reputation. Mailbox providers see through engagement farming. Validity may also detect and discount artificial signals. The score may move temporarily; actual placement at Gmail, Microsoft, and Yahoo doesn’t. Real improvement comes from real behavior changes.
Comparing your score to peers without context
Sender Score is a percentile ranking, but the percentile is calculated against all tracked sending IPs, which include consumer ISPs, transactional senders, marketing IPs, cold email IPs, and many others with very different baseline behaviors. Your 80 isn’t comparable to another company’s 90 unless you’re both in similar sending profiles. Compare it to your own historical baseline, not other senders.
Not pairing with first-party signals
Sender Score alone gives you the ecosystem view; it doesn’t tell you which provider is filtering you, which campaign caused a complaint spike, or whether your authentication is failing at one provider. Combine Sender Score with Postmaster Tools (Gmail v2, Microsoft SNDS, Yahoo Sender Hub Insights) for the operational picture. Senders relying only on Sender Score miss problems that surface in first-party data days earlier.
How Does Verification Affect the Sender Score?
Email verification directly improves multiple Sender Score components. Hard bounces from invalid addresses damage the Complaints and Filter Performance components, plus the External Reputation component if traps are hit. Verification at signup, on every imported list, and on a recurring schedule prevents the bounce damage that drives most Sender Score declines for senders with otherwise good behavior.
Sender Score components are downstream of behavior. Verification is upstream of the most common behavior that damages the score:
| Sender Score component | How verification affects it |
|---|---|
| Complaints | Verification reduces sending to invalid or disposable addresses; lower exposure to spam-trap-prone segments. Indirectly reduces complaints. |
| Volume | Cleaner lists support higher sustained volume without bounce-driven throttling. |
| External Reputation | Eliminates spam trap hits from invalid addresses. Reduces blocklist exposure. |
| Filter Performance | Lower hard bounce rate reduces filter-flagged sending patterns. |
| Additional signals | Cleaner engagement metrics; better authentication pass rates (no third-party tool sending to invalid addresses). |
Three verification layers that are compounded:
- Real-time verification at signup forms. Catches typos, disposable addresses, and obvious junk before they enter your database.
- Bulk verification on imported lists. Run before any third-party list goes into your active sending stream. Typical result: 20–30% of any imported list comes back as bad data.
- Quarterly bulk re-verification of the active subscriber list. B2B addresses decay at roughly 2.1% per month; B2C is slower but still meaningful over 6–12 months.
If you’re focused on improving Sender Score, list verification is almost always the highest-leverage starting point.
Run a sample of your active subscribers through EmailVerify.io bulk verification to see your current quality, or wire the verification API into your signup forms in an afternoon.
Verification doesn’t fix the complaint rate or improve content; those need other work, but it removes the largest single trigger of the bounce-driven Sender Score decline that most senders face.
Verification is one of the few deliverability investments where the ROI math is unambiguous. Verifying 100,000 addresses costs $50–$200 and takes a few hours. Recovering from sustained Sender Score damage takes 4–12 weeks of disciplined improvement plus the 2–4 week score lag. The verification investment prevents most of the damage that recovery work has to repair after the fact, which makes it the cheapest deliverability investment that exists in 2026.
Frequently Asked Questions
How Do You Improve Your Sender Score?
You improve your Sender Score by improving real sending behavior, not the number itself. Focus on keeping hard bounces below 2%, complaints under 0.1%, maintaining proper SPF/DKIM/DMARC alignment, sending consistently, and avoiding blocklists. Because the score uses a 30-day rolling window, meaningful improvements typically take 2–4 weeks to appear.
How Do You Check Your Sender Score?
You can check your Sender Score at senderscore.org by entering your sending IP address. The tool will show your overall score along with the five component indices. IP-based checks are more accurate than domain-based ones since Sender Score is primarily IP-focused.
What Is Return Path Sender Score?
Return Path Sender Score is simply the original name of Sender Score. The metric was created by Return Path in 2005 and later continued by Validity after its acquisition in 2018–2019. The underlying scoring system remains the same.
What Is a Good Sender Score?
A score of 90+ is considered excellent and usually aligns with strong inbox placement. Scores between 80–89 are generally healthy, 70–79 indicates caution, and anything below 70 suggests potential deliverability issues that need attention. Lower scores typically reflect higher complaint or reputation risk.
Why Does Your Sender Score Keep Changing?
Sender Score changes daily because it is based on a 30-day rolling average. Small fluctuations are normal and often not meaningful. Larger or sustained shifts usually reflect real changes in sending behavior, list quality, or shared-IP activity.
Does Sender Score Directly Affect Deliverability?
No. Mailbox providers like Gmail, Microsoft, and Yahoo do not use Sender Score in their filtering decisions. They rely on their own first-party reputation systems. Sender Score is best understood as an external indicator that reflects broader ecosystem reputation trends.
Can You Improve Sender Score on a Shared IP?
Yes, but only partially. Your sending behavior contributes to the shared IP’s reputation, but other senders on the same IP also affect it. This is why shared-IP users often see inconsistencies between Sender Score and actual inbox placement. In these cases, domain-level data is more reliable.
How Long Does It Take to Improve Sender Score?
Most improvements take about 2–4 weeks to show because of the rolling 30-day calculation. If reputation damage is severe, recovery can take 6–12 weeks of consistent clean sending behavior.
Is Sender Score the Same as Postmaster Tools Data?
No. Sender Score is third-party aggregated reputation data from Validity. Postmaster Tools (Gmail, Microsoft SNDS, Yahoo Sender Hub) are first-party data directly from mailbox providers. They complement each other but should not be treated as interchangeable.
What Is the Difference Between IP Reputation and Domain Reputation?
IP reputation evaluates the sending IP address, which is what Sender Score focuses on. Domain reputation evaluates your sending domain and is increasingly important for mailbox providers like Gmail and Microsoft. In shared-IP environments, domain reputation is often more reflective of your actual sending behavior.
Why Is Your Sender Score Low When Emails Still Land in Inbox?
This usually happens due to shared-IP contamination, low sending volume, or delays in the rolling average catching up to recent improvements. In many cases, your domain reputation is healthy even if the IP-level score looks weak. Always confirm with Postmaster Tools before reacting.
Should You Worry If Your Sender Score Drops Below 80?
Not immediately. A drop should be treated as a signal to investigate, not panic. Look at bounce rates, complaint trends, authentication health, and Postmaster Tools data. A sustained drop below 70 is more serious and usually indicates real reputation degradation.
Can Sender Score Predict If Your Email Will Land in Spam?
Only partially. Higher sender scores often correlate with better inbox placement, but the relationship is not exact. You can still land in spam with a good score if there are provider-specific issues or land in the inbox with a lower score if your domain reputation is strong. It should always be used alongside first-party provider data.
Final Thoughts
Sender Score is widely used in email deliverability, but it’s often over-interpreted. It compresses complex sending behavior into a single 0–100 IP reputation metric, making it useful for tracking and reporting but limited for operational decisions that require provider-level detail.
Three key takeaways matter most:
First, Sender Score is a Validity-owned, third-party signal. It reflects ecosystem observations, not mailbox provider decisions. Gmail, Microsoft, and Yahoo rely on their own first-party reputation systems, so Sender Score should be treated as directional rather than authoritative.
Second, its accuracy breaks down in common real-world scenarios, shared IPs, low-volume sending, B2B-heavy audiences, rapid behavior changes, and provider-specific issues. In these cases, domain-level tools like Postmaster Tools give a more accurate view of deliverability.
Third, deliverability improves when multiple signals are evaluated together. Sender Score should be used alongside Gmail Postmaster Tools, Microsoft SNDS, Yahoo Sender Hub Insights, complaint rates, reply rates, authentication health, and bounce monitoring. Many of these issues can also be prevented early with the trusted email verification service, helping maintain cleaner lists and a stronger sender reputation.
Is Your Sender Score Holding You Back?
Fix deliverability issues at the source with accurate email verification before every campaign.


