
Almost every email verification provider promotes an “accuracy rate” on its website, typically framed as 98%, 99%, or even 99.9%. On the surface, these numbers sound reassuring. But the problem is that they’re not standardized, not independently verified, and rarely comparable across tools.
Email verification is a classification problem, and like any classifier, performance depends on the dataset used for testing, how “ground truth” is defined, and which error types are included or ignored.
What makes this even more important is how closely it ties to real-world deliverability outcomes. Independent deliverability research suggests that nearly 1 in 6 emails never reaches the inbox (≈16%), highlighting how real-world performance often diverges from vendor-reported accuracy claims.
Two tools can both claim “99% accuracy” and still produce completely different bounce rates in real campaigns.
This guide breaks down how to evaluate verifier performance the right way, using confusion matrices, precision/recall, and real campaign data, not vendor marketing claims.
By the end, you’ll be able to evaluate vendor claims with the same skepticism a data scientist would bring to any other classifier.
Email verification accuracy shows how often a tool correctly classifies emails based on real delivery outcomes. There is no standard definition across vendors, so “99% accuracy” is not directly comparable between tools.
Accuracy alone is misleading because it hides key errors: false positives and false negatives. False positives matter most because they allow bad emails into campaigns and damage sender reputation.
Most vendor claims are based on controlled or selective datasets, not real sending conditions. The most reliable way to evaluate performance is a simple 30-minute test using your own data: run a sample list, send a real campaign to the “valid” group, and compare predictions against actual bounce results.
The real metric that matters is precision on delivered emails, not headline accuracy.
Table of Contents
Why Is “99% Email Verification Accuracy” Not Reliable?
If you take an average email list and randomly classify every address as Valid, you’ll be right about ninety percent of the time. That’s not because the classifier is good; it’s because most addresses are valid. A tool that labels everything as “Valid” will still look accurate on a clean list.
This is why “99% accuracy” is misleading. The number is driven more by the list than the verifier.
Accuracy varies based on:
- List quality: Clean lists inflate results; mixed data exposes errors
- Test setup: Controlled datasets don’t reflect real campaigns
- Measurement method: Some vendors ignore false positives entirely
A vendor testing on a clean list can report higher accuracy than one testing on messy data, even if the second performs better in production.
There’s also a definition problem. In practice, “accuracy” has a precise meaning, but most vendor claims don’t follow it.
When a vendor claims “99% accuracy,” the question that should immediately follow is:
Accuracy on what list?
Measured against what ground truth?
Counting which type of error?
If those three questions don’t have specific, public answers in the vendor’s methodology, the percentage is marketing copy, not evidence.
How Is Email Verification Accuracy Calculated?
In any binary classifier, accuracy is the fraction of predictions that match reality. For an email verifier, that means, of all the addresses the verifier classified, how many of those classifications were correct when checked against actual delivery outcomes.
The core formula:
Where TP, TN, FP, and FN are the four cells of a confusion matrix:
- TP (True Positive): The verifier said “Valid,” and the address was actually delivered.
- TN (True Negative): The verifier said “Invalid,” and the address actually bounced.
- FP (False Positive): The verifier said “Valid,” but the address bounced.
- FN (False Negative): The verifier said “Invalid,” but the address would have delivered.
The formula treats all four outcomes as equally important. In practice, they’re not. False positives almost always hurt more than false negatives, and a verifier evaluation that treats them the same is hiding the most important signal.
There’s also a more useful pair of metrics borrowed from information retrieval: precision and recall. They measure each direction of error separately.
Precision and recall:
For email verification, precision is almost always the metric that matters. You’re trying to keep Invalid addresses out of your sending pipeline. Recall is secondary: a slightly lower recall just means a few real addresses got marked as risky or unknown when they could have been confidently Valid, which costs you some reach but doesn’t damage anything.
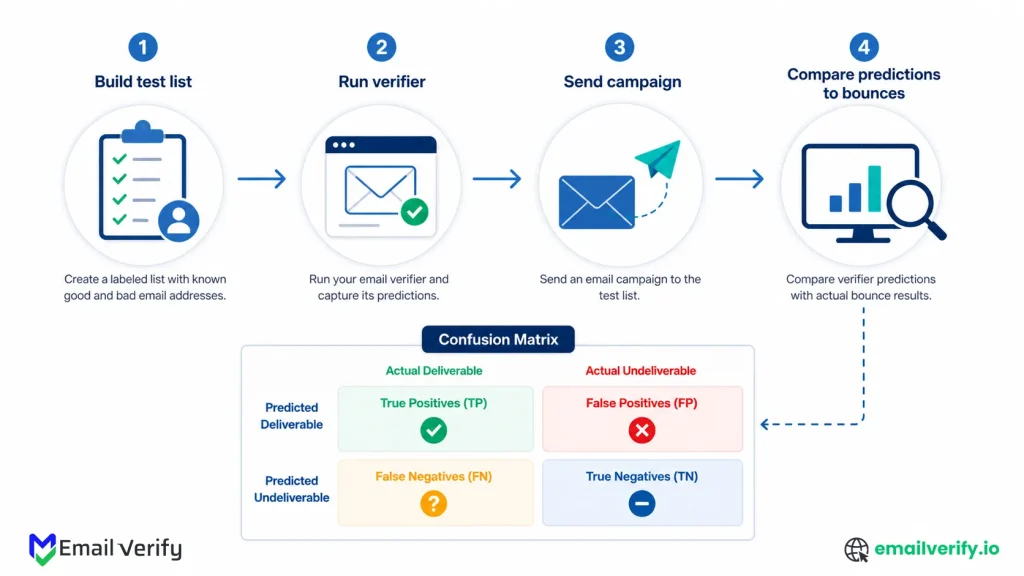
What Is a Confusion Matrix in Email Verification?
The confusion matrix is the standard way to display all four prediction outcomes in a single grid. It’s the single most useful tool for evaluating any classifier, including an email verifier.
Below is the matrix laid out the way every classifier evaluation in machine learning uses it, populated with example numbers from a hypothetical 1,000-address test.
| Actual: Valid | Actual: Invalid | |
|---|---|---|
| Predicted: Valid | True Positive 780 addresses correctly predicted as valid | False Positive 20 predicted as valid, but bounced |
| Predicted: Invalid | False Negative 30 predicted as invalid, but would have delivered | True Negative 170 correctly predicted as invalid |
Reading this matrix across both rows and both columns gives you the four metrics that matter.
| t2 | Formula | From this example |
|---|---|---|
| Accuracy | (TP + TN) / total | (780 + 170) / 1,000 = 95.0% |
| Precision | TP / (TP + FP) | 780 / (780 + 20) = 97.5% |
| Recall | TP / (TP + FN) | 780 / (780 + 30) = 96.3% |
| False positive rate | FP / (FP + TN) | 20 / (20 + 170) = 10.5% |
Notice that the same data set can produce a 95.0% accuracy headline (which sounds great) and a 10.5% false positive rate (which is alarming). Both are correct. Both describe the same verifier on the same list. Which one matters depends on what you actually care about: the average of all predictions, or the specific predictions that affect your bounce rate.
When you compare verifiers, always ask for precision on the valid class, not just headline accuracy. A verifier that says “valid for 100% of addresses” will have the same accuracy as one that’s genuinely careful on most lists because most addresses really are valid. Precision is the number that exposes the difference.
Why False Positives Hurt More Than False Negatives
In email verification, both error types matter, but they don’t impact your system equally.
A false positive happens when a verifier marks an email as valid, but the address actually bounces. A false negative is the opposite: the verifier marks an email as invalid, but the address could have successfully received mail.
On the surface, these may look like symmetric errors. In real-world email delivery, there are not.
False Positive Cost: Deliverability Damage
False positives directly affect your sending infrastructure. When a bad address is labeled “Valid” and included in a campaign, the result is a hard bounce.
That creates a chain reaction:
- An immediate hard bounce is recorded by mailbox providers.
- Sender reputation signals are negatively impacted.
- Future emails may land in spam or be throttled.
- Overall sender reputation can degrade over time.
The critical issue is propagation. A single bad send can influence how future campaigns are treated by providers like Gmail, Outlook, and Yahoo.
False Negative Cost: Lost Reach
False negatives behave differently. When a real email is incorrectly marked invalid, it is simply excluded from your campaign.
The impact is:
- Lost contact opportunity
- Reduced campaign reach
- Potential loss of engagement or revenue from that address
However, this impact is bounded. It does not damage deliverability or affect other recipients. It only affects the single excluded record.
| Aspect | False Positive (FP) | False Negative (FN) |
|---|---|---|
| What happened | The verifier said valid; the address bounced. | The verifier said invalid; the address was real. |
| Direct cost | Hard bounce recorded against your domain. | One real contact suppressed. |
| Indirect cost | Sender reputation damage, future filtering. | Lost reach to that contact. |
| Scope | Propagates to entire send and future campaigns. | Bounded to the misclassified address. |
| Recovery time | Weeks of careful sending to repair reputation. | Immediate (re-include the address). |
The right way to read accuracy claims is through the lens of the asymmetry. A verifier with 99.5% accuracy and a 5% false positive rate is worse, in practice, than a verifier with 98% accuracy and a 1% false positive rate. Headline accuracy doesn’t tell you which way the errors lean.
How to Measure Email Verifier Accuracy Using Real Campaign Data
The only reliable way to evaluate email verifier performance is to compare its predictions against real delivery outcomes. In other words, you need ground truth from actual email-sending behavior, not vendor-reported benchmarks.
Ground truth in this context comes from whether an email is actually delivered or hard-bounced in a real campaign.
This shifts accuracy from a theoretical metric into something you can measure directly using your own data.
Cohort 1: The Sent Cohort
Start with a group of email addresses that you actually send a campaign to. This is your sent cohort.
For each address in this cohort, you now have two signals:
- The verifier’s prediction (Valid / Invalid)
- The real-world result (Delivered / Hard Bounce)
This pairing is what makes accuracy measurable.
Cohort 2: The Bounced Cohort
Within the sent cohort, there is a smaller subset that actually bounces. This becomes your bounced cohort.
These are your confirmed invalid addresses based on real delivery failure.
By cross-referencing this bounced cohort against the verifier’s predictions, you can evaluate performance in two important ways:
- How many bounces were correctly identified in advance (true negatives)
- How many were missed and incorrectly marked as valid (false positives)
This is where most vendor claims start to break down in real usage.
The Cleanest Accuracy Signal
The most practical way to evaluate performance is to focus only on the verifier’s Valid predictions and measure how many of them actually deliver.
For Example:
If you send to 800 addresses marked “Valid” and 20 of them hard-bounce, then:
- 780 actually delivered
- 20 failed
So the verifier’s precision on the valid class becomes:
780 / 800 = 97.5%
That single number, derived from your own sending behavior, is far more meaningful than any vendor-reported accuracy claim.
Why This Method Works
Unlike vendor benchmarks, this approach:
- Uses your real audience mix
- Reflects your actual sending infrastructure
- Captures provider-specific behavior (Gmail, Yahoo, Outlook differences)
- Measures real deliverability impact instead of theoretical classification accuracy
In practice, this is the only evaluation method that translates directly into sender reputation and campaign performance.
How to Test Email Verification Accuracy in 30 Minutes (Step-by-Step)
Here’s the test. It produces a real, comparable accuracy number for any verifier on a list you control. Total elapsed time is roughly 30 minutes of active work, plus 24 hours for the test campaign to bounce out and stabilize.
| Step | What You Do | Time |
|---|---|---|
| 1 | Build a test list of 500–1,000 addresses with a known mix. | 10 minutes |
| 2 | Run the list through the verifier under evaluation. | 5 minutes |
| 3 | Send a real campaign to the verifier-valid subset. | 5 minutes |
| 4 | Wait 24 hours for bounces to come back through the ESP. | (elapsed time) |
| 5 | Cross-reference verifier predictions with bounce data. | 10 minutes |
| 6 | Calculate precision, recall, and false positive rate. | 5 minutes |
The next four sections walk through each step in detail. The total cost is the verification credits for 1,000 addresses (small) plus a single ESP send to a small list (small). For most teams, both are within an hour’s discretionary budget.
Step 1: Build a Test Email List for Accuracy Testing
| Source | Approximate Share | Why It's in the Mix |
|---|---|---|
| Active engaged subscribers | 40–50% | Establishes a baseline; should mostly come back Valid |
| Dormant subscribers (6–12 months) | 30–40% | Where decay-detection ability is exposed. |
| Cold or imported list | 20–25% | Where the verifier’s real work happens. |
The most important part of the test is getting the test list right. A test list that’s too clean (all known-good addresses from your active customer base) will overstate accuracy because every verifier will look perfect. A test list that’s too dirty (purchased lead lists, scraped data) will understate accuracy because the underlying delivery rate is so low that verifier choices barely matter.
The right shape is a mix that mirrors the kind of data you’ll be running through the verifier in production. For most teams, that’s a blend of three sources:
- Active customers and engaged subscribers (high baseline deliverability).
- Older subscribers who haven’t engaged in 6–12 months (mixed deliverability).
- Recently imported records from a less curated source: cold list, vendor data, scraped contacts (low baseline deliverability).
A practical breakdown for a 1,000-address test list:
Don’t hand-pick the test list. Pull a random sample from each source category, set the seed if you’re using code, and document the sample. If you ever want to re-run the test against a different verifier, you’ll need exactly the same input list to compare results fairly.
Building a test list entirely from your verified, engaged customer base. The bounce rate will be near zero regardless of which verifier you use, every vendor will look perfect, and you’ll learn nothing. The point of the test is to expose differences, which means including addresses where the answer is genuinely uncertain.
Step 2: Run Email Verification and Capture Meaningful Results
Upload the test list to the verifier you want to evaluate. Run it. Download the result file. The output should give you a status and a reason code per row. Save the entire result, not just the Valid subset.
Two things are worth recording at this stage, beyond the predictions themselves:
- Total verification time. How long did the run take? This is your real-world throughput data, useful when comparing vendors with different infrastructure.
- Distribution of statuses. What percentage came back Valid, Risky, Unknown, Invalid? A wildly skewed distribution (95% Valid on a list you know is mixed) is itself a signal.
If you’re testing multiple verifiers, run all of them on exactly the same list. Variations in input will completely confound the comparison. Use the same CSV, the same column ordering, the same encoding. Treat the test list as a fixed input artifact, not something you regenerate per vendor.
If two verifiers produce dramatically different status distributions on the same list, the difference isn’t random. One of them is making different judgments about catch-all domains, anti-probe responses, or ambiguous cases, and the actual campaign send will tell you which one was closer to the truth.
Step 3: Send a Test Email Campaign to Measure Accuracy
Now you need ground truth. The cleanest way to get it is to send a real, low-volume campaign to the addresses the verifier classified as Valid, and observe what bounces.
What to Send
Anything genuinely benign. A single-paragraph newsletter, a low-stakes update, a reactivation message. The content doesn’t have to be elaborate; it just has to be a real send through your normal ESP, with normal authentication (SPF, DKIM, and DMARC) configured. The goal is to capture which addresses actually accept mail and which produce hard bounces, which is the bounce-vs-deliver signal you need.
What Not to Send
Don’t send anything that could trigger spam complaints from real recipients. The test cohort should be addresses where you have plausible permission to send (active subscribers, dormant subscribers, opted-in cold list). If your only test cohort is purchased data with no permission, you have a separate problem that’s outside the scope of this article, and the test isn’t safe to run as described.
How Much to Send
If your test list has 1,000 addresses and the verifier classified 700 as Valid, send to those 700. The Risky and Unknown buckets are interesting separately, but the headline accuracy number comes from the Valid group, where the verifier has expressed confidence.
Optionally, if you have a spare budget and risk tolerance, also send a smaller sample of risky and invalid addresses to see how often those buckets actually bounce. Real production sending wouldn’t include them, but for a test, the data is informative.
Sending the test campaign from your main marketing domain. If the test list contains a meaningful share of bad addresses (and it should, by design), the bounces will be recorded against your real sender reputation. Use a separate subdomain, a separate sender, or a dedicated test ESP account so the test doesn’t damage your main programs.
Step 4: Calculate Email Verification Accuracy Using Bounce Data
Twenty-four hours after the send, pull the bounce report from your ESP. You’re looking for the count of hard bounces in each verifier-prediction bucket. Soft bounces (mailbox full, temporary issues) are a separate signal and shouldn’t be counted as invalid for this test.
The math is simple. Suppose the test produced these numbers:
| Verifier Status | Count Sent | Hard Bounces |
|---|---|---|
| Valid | 700 | 12 |
| Risky | 150 | 38 |
| Unknown | 80 | 11 |
| Invalid | 70 | 60 |
The headline metric (precision on the Validclass) is the easy one:
That’s the most important number from the whole test. It says, “Of the addresses this verifier confidently labeled as Valid, 98.3% actually delivered. The other 1.7% are false positives, and they’re the addresses that would damage your sender reputation in production.
You can also calculate equivalent metrics for the other buckets:
Bounce rate by bucket:
- Valid: 12 / 700 = 1.7% (false positives)
- Risky: 38 / 150 = 25.3% (correctly graded as risky)
- Unknown: 11 / 80 = 13.8% (uncertain, mostly delivered)
- Invalid: 60 / 70 = 85.7% (correctly suppressed)
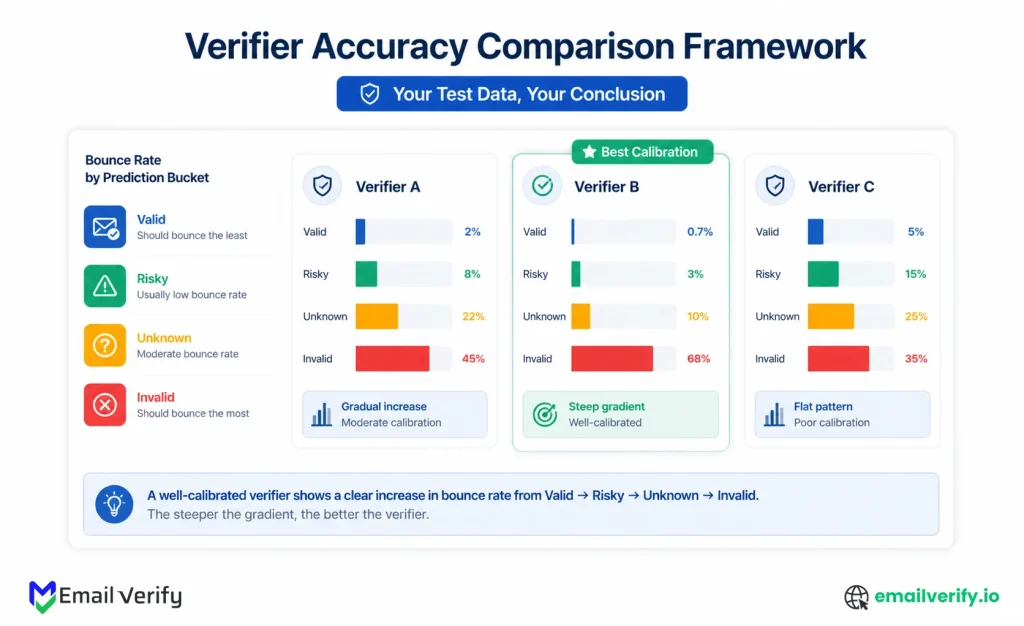
If those numbers look right, the verifier is doing its job. A valid should have a low bounce rate. Risky should have a noticeably higher bounce rate (which is exactly why it’s labeled Risky). Unknown should sit somewhere in the middle. Invalid should bounce most of the time, confirming the verifier was right to flag those addresses for suppression.
The shape of the bounce rates across the four buckets is itself a quality signal. A verifier whose Valid and risky buckets have similar bounce rates isn’t actually distinguishing the two categories meaningfully; it’s just labeling addresses without separating signal from noise. A verifier where the bounce rate climbs cleanly from Valid to Invalid is genuinely sorting addresses by deliverability risk.
Step 5: How to Interpret Email Verification Accuracy Results
Once you have the numbers, the next step is to pick a single headline metric and declare a winner. Resist it. The real comparison comes from looking at the full picture: precision, the gradient across buckets, the throughput, and the consistency of catch-all and risky labeling.
Here’s a comparison framework that captures what actually matters when picking between verifiers:
| Dimension | What to Look At | What Good Looks Like |
|---|---|---|
| Precision on Valid Emails | Bounce rate within the Valid bucket. | Below 2%, ideally below 1%. |
| Gradient across buckets | Bounce rate climbing from Valid to Invalid | Clear, monotonic increase. |
| Risky labeling honesty | Bounce rate within the Risky bucket. | Meaningfully higher than Valid. |
| Status distribution | Percentage in each bucket on a mixed list. | Realistic mix; Valid not 95%+ on dirty data. |
| Throughput | Time to process the full test list. | Fits your real-world batch needs. |
| Reason code coverage | Are reasons (catch-all, role, anti-probe) provided? | Reasons are present and accurate. |
| Consistency between modes | Real-time API result vs. bulk result for the same address. | Identical or near-identical. |
If a verifier wins on precision but has only two buckets (Valid and Invalid, no graded risky/unknown), it’s hiding ambiguity in one of the two categories. If a verifier has all four buckets but the bounce rates within them don’t follow a clear gradient, the bucket labels don’t mean much. The shape of the data tells you whether the verifier is genuinely calibrated.
Why Email Verification Tools Give Different Results on the Same List
If you run the test on more than one verifier, you’ll see disagreement on a meaningful share of addresses. Where they disagree is informative, because it usually maps to the four hardest cases in email verification.
Catch-All Domains
Verifier A grades a domain as “Valid” based on a clean 250 OK from the SMTP probe. Verifier B grades the same domain as Risky after running a catch-all detection probe and seeing the server accept random addresses too. Verifier B is doing more work; whether the extra work is correct depends on whether the underlying mailbox actually exists, and the ground-truth bounce data will reveal which one was right.
Yahoo, AOL, and Other Anti-Probe Providers
Verifier A treats a Yahoo 250 OK as confidently Valid. Verifier B grades Yahoo addresses as Risky with an “anti-probe” reason code. The bounce-rate data on Yahoo addresses in your test will tell you which behavior matches reality. (In our experience, the honest answer is closer to Verifier B’s, because Yahoo’s RCPT TO responses are intentionally vague.)
Greylisted Servers
Verifier A retries automatically and gets a clean answer; Verifier B treats the first 4xx response as Unknown without retrying. Verifier A’s result is more useful in production. The disagreement here usually shows up as Verifier B having a much higher Unknown rate on the test list.
Disposable and Role-Based Detection
Verifier A flags info@ and admin@ as role-based emails; Verifier B doesn’t and instead labels them “Valid.” Same with disposable email addresses: depending on how recently each verifier’s database was updated, the same address can be flagged differently. Both are valid choices, but they have different downstream consequences for engagement metrics.
In every case, the bounce data is the tiebreaker. If Verifier A’s Valid predictions have a 1% bounce rate and Verifier B’s have a 4% bounce rate on the same test list, Verifier A is being more conservative, and Verifier B is calling more addresses Valid than it should. The disagreement is real, the test exposes it, and the math is unambiguous.
Our deeper guides on SMTP verification and how email verification works walk through the technical reasons each of these disagreements happens, which is useful background if you want to understand why two verifiers can produce different answers on identical inputs.
Common Mistakes When Comparing Email Verification Tools
Most teams don’t get misleading results from email verification itself. The real issue shows up in how the evaluation is run, uneven sample lists, inconsistent bounce definitions, or over-reliance on vendor-reported metrics. Small methodological gaps can easily make performance look better or worse than it actually is.
Here are the most common pitfalls that quietly skew results.
Comparing Headline Accuracy Numbers
Vendor accuracy claims are calculated against vendor-chosen test sets. They aren’t comparable to each other, and they almost always exclude false positives. Run your own test on your own list, or use someone else’s test that names the methodology and the data.
Testing on a Clean List
If your test list is mostly active engaged subscribers, every verifier will look perfect. The test reveals nothing. Include cold, dormant, and imported data so the harder cases actually appear in the input.
Confusing Soft Bounces with Hard Bounces
Soft bounces (mailbox full, temporary unavailable) aren’t undeliverability signals. They’re transient. Counting them as bounces in the test will overstate the apparent error rate of every verifier. Filter your bounce report to hard bounces only before doing any math.
Sending the Test from Your Main Sending Domain
If the test list contains real invalid addresses, the bounces will be logged against your main sender reputation. Use a separate subdomain or a dedicated test account. The whole point of measuring accuracy is to make better decisions for your main domain, not to damage it during the measurement.
Drawing Conclusions from a Tiny Sample
A test list of 100 addresses isn’t enough to distinguish a 1% false positive rate from a 3% false positive rate; the noise is too large. Aim for at least 500 addresses, ideally 1,000. The verification credits are cheap; the additional statistical confidence is worth the spend.
Ignoring the Risky and Unknown Buckets
If a verifier has a 30% Risky rate on your test list, you can’t just ignore those addresses; they’re a meaningful share of your sending population. Look at how the verifier expects you to handle them, what the bounce rate within them actually is, and if the segmentation logic fits your real workflow.
Pre-test sanity checklist:
- The test list is at least 500 addresses, ideally 1,000.
- List includes a mix of clean, dormant, and cold sources.
- List is fixed and reused identically across vendors.
- Send goes from a sandboxed subdomain or test account.
- Bounce analysis filters to hard bounces only.
- The sample is run through every vendor before any send.
Which Email Verification Accuracy Claims Should You Not Trust?
Once you’ve internalized how accuracy is really measured, certain vendor marketing claims start to read very differently.
Here are the patterns that signal a vendor is hiding more than it’s revealing.
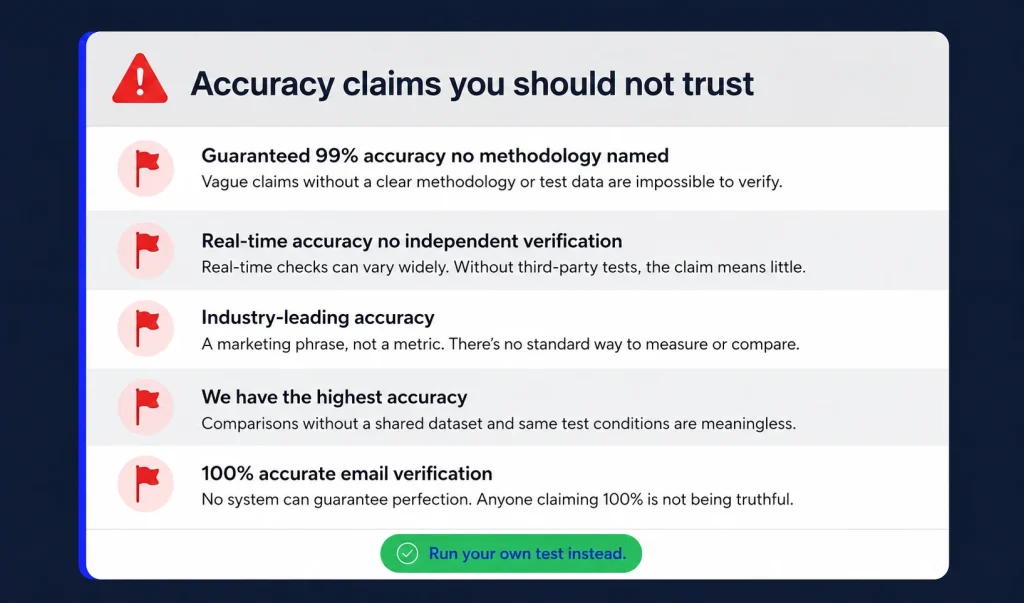
“Guaranteed 99% Accuracy” Without a Methodology
Accuracy is a measurement. A vendor that claims a specific percentage but won’t say how they measured it (which list, which ground truth, which class of error) is making a marketing claim, not a technical one. A trustworthy vendor names the methodology in public, even if the methodology has limitations.
“We Detect Catch-All Domains” Without Returning Them
If a vendor’s output never includes a Risky or catch-all status, they’re either ignoring catch-all detection entirely or hiding it inside the Valid label. Either way, you’re getting bounces in production from addresses the verifier should have flagged.
“100% Accurate on Yahoo and AOL”
Yahoo and AOL deliberately obscure RCPT TO responses to prevent abuse. No SMTP-based verifier can be 100% accurate on those providers, because the underlying signal isn’t there. A vendor claiming 100% on Yahoo is, almost always, just accepting Yahoo’s misleading 250 OK at face value and labeling everything Valid.
Disclaimers Buried in the Footer
Sometimes the methodology is honest, but the headline is not. Look at the disclaimer text near vendor accuracy claims. “99% accuracy on confirmed Valid addresses” is not the same as “99% accuracy on the full input list,” and the difference matters enormously.
Refunds for Bounces, but Only “Certain Bounces”
A bounce-back guarantee sounds reassuring until you read the conditions. Most include exclusions for catch-all, role-based identification, free-provider, and risky categories, which together can represent a meaningful share of false positives. A guarantee that excludes the most common failure modes is mostly marketing.
The single most common mistake when buying verification: picking the vendor with the highest headline accuracy claim. Headline accuracy is a function of the test set, the methodology, and the marketing department, not the underlying technology. Run your own test on your own data with the math in this article. The answer will be more useful than any vendor pitch.
How Does EmailVerify.io Measure Email Verification Accuracy?
We’re going to be honest about something: EmailVerify.io doesn’t claim a single accuracy number on our marketing pages, because we don’t think a single number captures what matters.
Accuracy depends on the list you run, the underlying provider mix, the catch-all density, and the false-positive tolerance of your specific use case.
EmailVerify.io focuses on transparency in outputs rather than a universal score.
Every result includes:
- A status: Valid, Invalid, Catch All, Do Not Mail, Role-Based, Unknown, or Skipped
- A reason code explaining why the classification was made
- Supporting signals such as catch-all detection, role-based identification, and provider behavior
This structure makes results fully testable. You can apply the 30-minute evaluation method from this guide and measure precision using your own sending data. That figure becomes your real accuracy benchmark, not a vendor-reported percentage.
If you want to run the test, the easiest start is to upload a sample list through EmailVerify.io bulk verification or run a few addresses through the verification API. Pricing is on the pricing page, and a sample of 1,000 addresses costs less than the time it takes to set up the test.
If you do run the test on multiple vendors, share the numbers internally before picking a winner. Different stakeholders weigh false positives and false negatives differently; marketing teams care about reach, deliverability ops cares about reputation, and sales cares about pipeline. The test gives every stakeholder the data to advocate from, instead of relying on vendor claims none of them can verify.
Frequently Asked Questions
2. What Is a Good Accuracy Rate for an Email Verifier?
A 97% or higher precision rate on valid emails is generally considered strong. This usually translates to a hard bounce rate under 3%, which is acceptable for most email platforms. However, performance can drop on lists with high catch-all usage or older, less verified data sources.
3. Can I Trust “99% Accuracy” Claims From Vendors?
Not reliably. These figures are often based on controlled or undefined test datasets and may exclude key error types like false positives. Since no standard benchmark exists across tools, two vendors can both claim 99% and still produce very different bounce outcomes on the same list. Independent testing is the only reliable validation method.
4. How Do I Test Email Verifier Accuracy?
Use a controlled sample of around 1,000 email addresses that includes active, dormant, and cold data. Run it through the verifier, send a real campaign to the “Valid” group, and compare results after bounce data is collected.
Accuracy is calculated using precision: (Correct Valid Predictions) ÷ (Total Valid Predictions).
5. What Is The Difference Between Accuracy, Precision, And Recall?
- Accuracy: Overall correctness across all predictions (Valid and Invalid).
- Precision: How often “valid” predictions are actually valid emails. This is the most important metric for email verification.
- Recall: How many truly valid emails were correctly identified as valid.
In practice, precision matters most because it directly impacts bounce rate and sender reputation.
6. How Often Should Email Verification Accuracy Be Tested?
Once per year is usually enough. Email provider behavior changes over time (especially Gmail, Yahoo, and Microsoft domains), and verification systems evolve as well. Annual testing ensures your tool still performs well on your current data mix without unnecessary operational overhead.
7. Will Email Verification Accuracy Be the Same on Every Email List?
No. Accuracy changes based on list composition, including catch-all domains, data age, and email provider distribution. A verifier may perform well on structured B2B data but differently on consumer or scraped lists. That’s why real-world testing on your own dataset is the only reliable benchmark.
Final Thoughts
Email verification accuracy isn’t something that can be understood through a single marketing number, because real performance only becomes clear when it’s measured against actual sending behavior.
Once you start evaluating tools using real campaign outcomes, the perspective changes quickly. Instead of focusing on advertised percentages, the attention shifts to how closely a verifier’s predictions match what actually happens in your inboxing results. That’s where patterns like precision, false positive rates, and bucket-level behavior start to matter far more than headline claims.
The 30-minute test outlined in this guide is designed for exactly that shift. It gives you a structured way to validate any verifier using your own list, your own email service provider, and real bounce data. No assumptions, no vendor-controlled datasets, and no hidden methodology gaps.
In practice, the real difference between email verification tools only becomes visible when Valid emails are measured against actual delivery and when Risky or unknown classifications are judged by how they behave in real sends. That comparison is what exposes whether a tool is truly filtering risk or just labeling data.
The key takeaway is straightforward: accuracy only has meaning when it is grounded in your own data. Everything else is just a claim without context. Consistently using the right email verification services ensures your campaigns stay on track and your reputation stays strong.
Run the 30-minute test on your own list
Upload a 1,000-address test list to EmailVerify.io bulk verification, run the test, and calculate the precision number for yourself. The math takes a calculator. The conclusion takes 24 hours.


