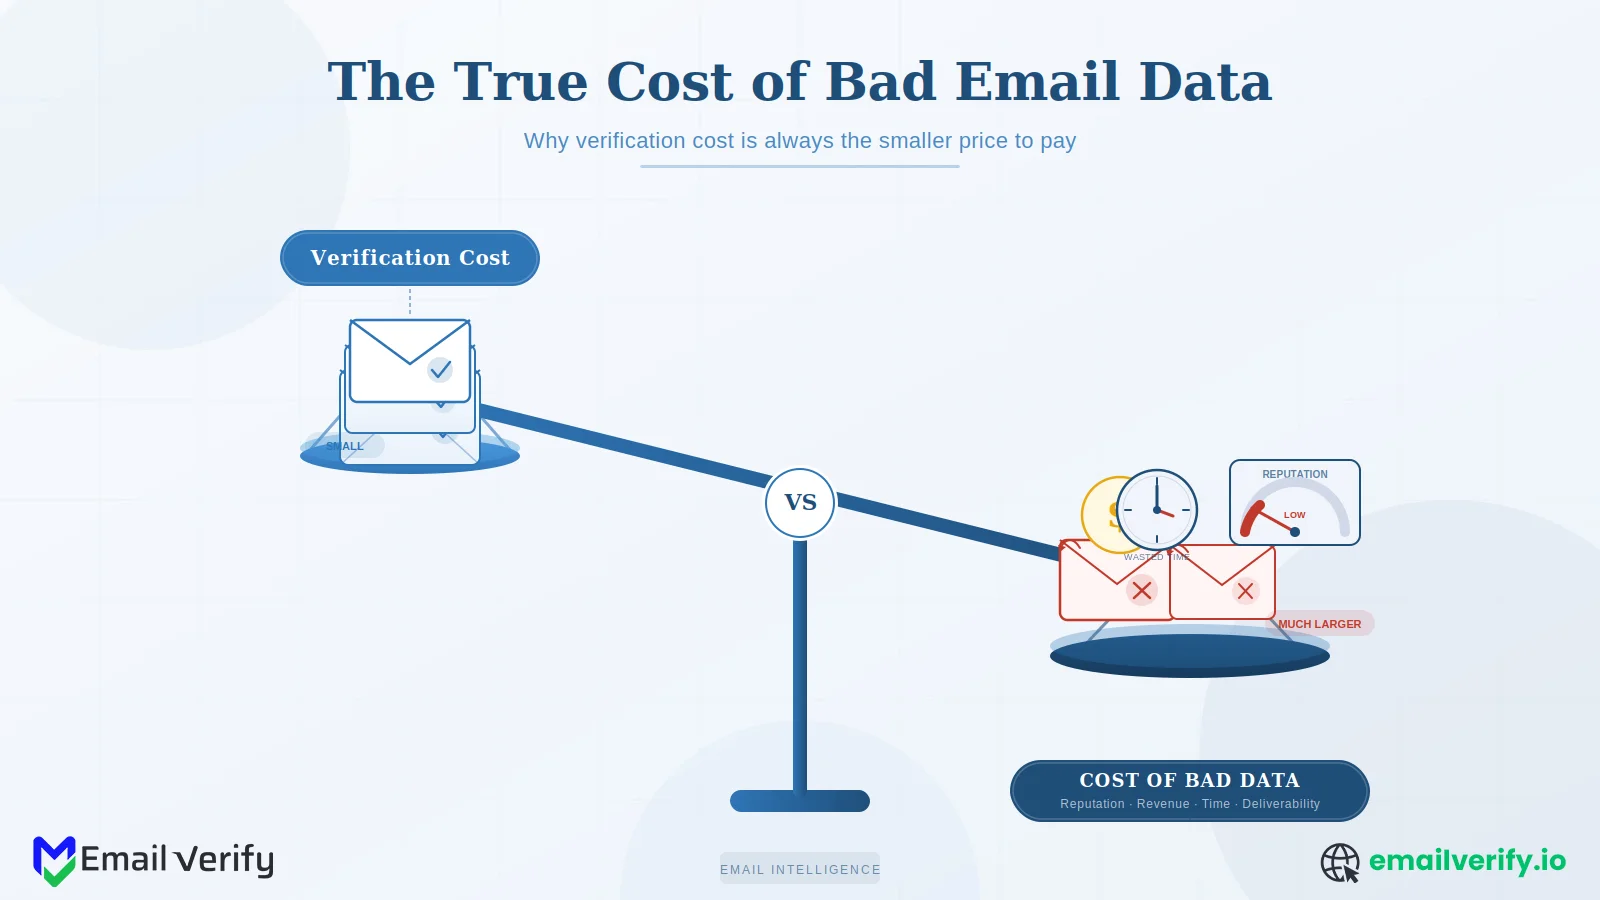
If you’ve ever tried to get email verification approved as a line item, you’ve probably had this experience: the request looks small on paper, the value sounds intuitive, but the budget meeting goes sideways because nobody has the math to prove it.
How much does dirty data actually cost us?
It is a fair question, and most teams answer it with hand-waving instead of arithmetic. That is surprising given the scale of the problem. Research shows that email databases decay by about 22.5% every year due to job changes, typos, and abandoned inboxes.
This article fixes that. We’ll walk through the six concrete categories of cost that bad email data produces, give you a calculation framework you can apply to your own numbers, and run the math three different ways: a 100,000-contact mid-market scenario, a 1-million-contact enterprise scenario, and a high-stakes cold outbound scenario.
The numbers won’t be your numbers, but the structure will be, and the worked examples make it easy to plug in your own list size, send frequency, and revenue per send.
Two ground rules before we start. First, the example numbers in this article use placeholder rates so the math is easy to follow. Replace them with your own. Second, this isn’t a sales pitch.
The point is to give you a clean, honest model of the cost of bad data so you can make the budget decision yourself, with whatever vendor (or in-house solution) makes sense.
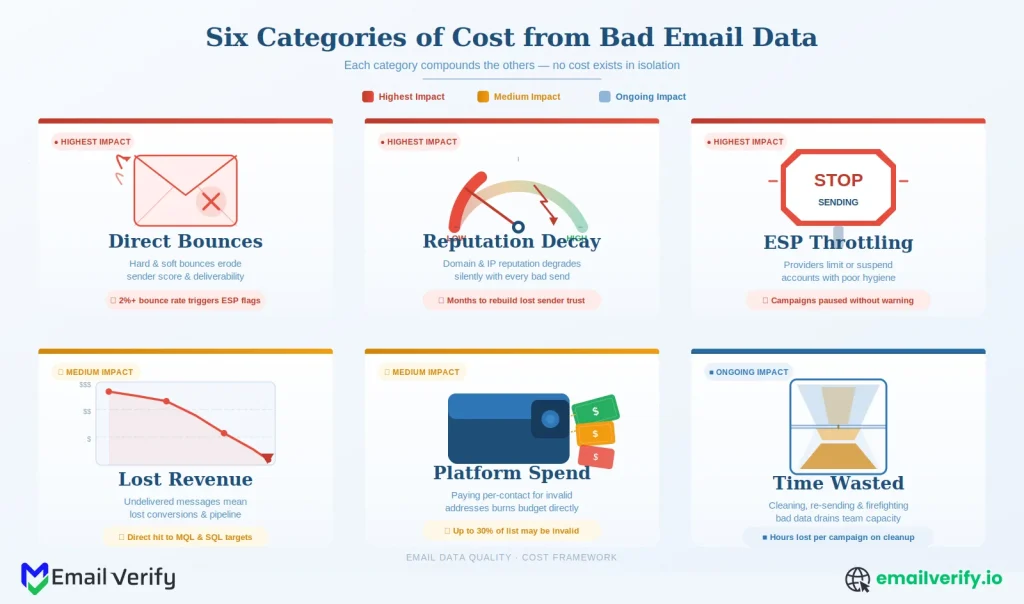
Bad email data costs you in six measurable categories: direct bounce damage (failed sends, ESP fees), sender reputation decay (lower inbox placement on every campaign), ESP throttling (capped sending volume), lost revenue from suppressed engagement (good campaigns landing in spam), wasted platform spend (paying for dead contacts), and sales/operational time (reps emailing inboxes that don’t exist).
For a mid-market company sending to 100,000 contacts monthly with a 5–10% bad data rate, the all-in cost typically runs into tens of thousands of dollars per year. For an enterprise list of one million contacts, the cost runs into low six figures. For cold outbound at scale, the worst-case scenario is a reputation collapse that can’t be priced because it bottlenecks every future campaign.
Verification almost always pays for itself by the second campaign after deployment. The exact ROI depends on your numbers; the worked examples in this article let you replace the placeholder values with your own and produce a real ROI estimate in five minutes.
Table of Contents
What Has Changed in the Last Two Years That Increased the Cost of Bad Email Data?
Three things have changed in the past two years that have raised the cost of bad email data without most teams noticing.
The first is the tightening of bulk sender requirements. Gmail, Yahoo, and Outlook all now publish stricter thresholds for hard bounces, spam complaints, and authentication, and crossing those thresholds produces measurable deliverability damage on every campaign that follows.
The second is AI-driven inbox filtering. Modern filters look at engagement patterns, content signals, and sender behavior over time, and lists with high proportions of dead, disposable, or role-based addresses produce engagement signatures that filters classify as low-quality outreach.
The third is the platform-cost layer. Marketing automation platforms, CRMs, and ESPs all charge per contact, and dead contacts are line items on every monthly bill until you remove them.
Together, these three trends have moved bad email data from a moderate inefficiency to a meaningful operational tax.
Most teams haven’t run the math because the costs are spread across multiple budgets (deliverability ops, sales, marketing platform, and ESP fees), and no single line item makes the issue visible.
The single biggest reason bad data costs are invisible is that they’re spread across multiple owners. Marketing pays for the ESP, sales pays for the CRM, RevOps owns the deliverability metrics, and engineering owns the signup forms. Each cost looks small in isolation. Adding them up is the only way the full picture emerges.
What are the Main Costs of Bad Email Data? Top 6 Areas Explained
Bad data costs show up in six places. They’re not all the same kind of cost, and they don’t all show up in the same budget.
Some are direct cash outflows; others are revenue you never capture. Some are bounded; others compound over time.
Here’s the full environment, with severity ratings to indicate how much each one typically contributes to the total.
| Cost Category | Severity | Main Impact | Recovery Time |
|---|---|---|---|
| 1. Direct bounce damage | Medium | Failed sends, hard bounces logged against your domain, partial ESP fees burned on undeliverable addresses. | Per-send. |
| 2. Sender reputation decay | High | Lower inbox placement on every campaign, more mail filtered to Promotions or spam, engagement metrics depressed across the board. | Weeks of careful sending to recover. |
| 3. ESP throttling | High | Sending platform reduces your throughput when bounce or complaint rates exceed thresholds. Campaigns delayed; some never finish. | Days to weeks. |
| 4. Lost revenue from suppression | High | Good campaigns to good contacts land in spam because reputation is degraded. Open rates drop, click rates drop, conversions drop. | Compounds across all future campaigns. |
| 5. Wasted platform spend | Medium | ESP and CRM fees per contact include dead inboxes, role-based addresses, and disposable mailboxes that will never engage. | Per-billing-cycle ongoing. |
| 6. Sales and operational time | Medium | Reps emailing inboxes that don’t exist, support tickets from users who never received confirmation, RevOps cleanup work. | Recurring. |
The next six sections walk through each cost in detail with the calculation logic. After that, three worked examples show how the math comes together for typical company shapes. Read straight through, or skip to the example closest to your situation and use the section references to drill into the costs that matter most.
Cost 1: Direct Bounce Damage
This is the most visible cost and the easiest to calculate. Every email you send to an address that doesn’t exist produces a hard bounce.
The ESP charges you for the send (most providers count it against your monthly volume), the bounce is recorded against your sending domain, and the address either stays in your list or gets auto-suppressed depending on your platform.
The math is simple. The cost per bounce is roughly the per-message cost of your ESP, plus a small overhead for the bounce-tracking infrastructure most platforms include in their fees.
That dollar amount, on its own, doesn’t justify a verification line item. But this is just one of six costs, and bounce damage is the smallest of the meaningful ones. The reputation-and-throttling costs that follow are where bounce damage actually hurts.
Stopping the cost analysis at “we pay $X per bounce.” That number is real but small. The reputation and throttling costs cascading from those bounces are 10x to 50x larger, and they’re the actual reason verification matters. Always calculate the indirect costs alongside the direct ones.
Cost 2: Sender Reputation Decay
Sender reputation is the score mailbox providers calculate continuously based on bounce rates, spam complaints, engagement signals, and authentication consistency.
When the score drops, more of your mail starts landing in spam or promotions instead of the primary inbox, even for engaged subscribers who would otherwise read it.
The damage from reputation decay is harder to count exactly, because it shows up as a depressed engagement rate across every campaign rather than a discrete event.
The way to think about it is in terms of inbox-placement percentage. A sender with a clean reputation might land 95% of mail in the primary inbox; a sender with a damaged reputation might land 70% or less.
The difference is the share of your audience that effectively never sees your campaigns, even though you paid to send them.
Two things to notice. First, the cost number is much larger than the direct bounce cost from the previous section. Second, the calculation depends entirely on your revenue_per_engagement value.
For some businesses (transactional email, account confirmations), the revenue per engagement is essentially zero in the short term, but the long-term cost of failed activations is much larger.
For others (eCommerce, SaaS upgrade prompts), the revenue per engagement is a clearly trackable number from your analytics.
Reputation decay is the cost most teams get wrong, in both directions. Underestimating it (“it’s just a few percent of inbox placement”) misses the compounding effect across every campaign. Overestimating it produces dramatic but unbelievable numbers. The honest middle is to use a conservative 5–15 percentage-point delta in inbox placement and let the math do the work.
Cost 3: ESP Throttling and Inbox Placement
Most ESPs throttle sender accounts when bounce or complaint rates cross thresholds. The throttling can take several forms: reduced send rate (your campaign goes out over hours instead of minutes), capped daily volume, suspension of new IP allocation, or, in extreme cases, account review.
Throttling has two cost components. The direct one is opportunity cost: a campaign that takes six hours to send instead of fifteen minutes hits subscribers at suboptimal times, reducing open and conversion rates. The indirect one is workflow disruption: marketing teams build their campaigns around predictable send timing, and unpredictable throttling breaks that planning.
If your team has ever lived through an ESP throttling event, you don’t need this math; you already know the disruption is meaningful. If you haven’t, the calculation gives you the order of magnitude.
Cost 4: Lost Revenue from Suppressed Engagement
This is the cost that overlaps with reputation decay, but deserves its own line because it shows up differently in reporting. Suppressed engagement isn’t just lower open rates; it’s the cumulative effect of every campaign reaching fewer engaged eyes than it should.
The scenario plays out like this. Your bad data inflates bounce rates on a few campaigns. Mailbox providers degrade your reputation. Future campaigns to your good contacts land in spam or promotions at higher rates. Engaged subscribers don’t see your mail, don’t open it, and don’t click. The ESP records depressed open rates, which mailbox providers then use as a further negative signal. The next campaign performs worse than the last, and so on.
This is usually the largest line in the calculation for revenue-driven email programs. The number is also the most sensitive to inputs: changing your assumed open-rate gap from six points to three points cuts the cost in half. Use the most conservative numbers you can justify, and the math will still come out compelling.
Cost 5: Wasted Platform Spend
Almost every email-related platform charges per contact, per send, or both. Marketing automation tools, CRMs, ESPs, and sales engagement platforms. They all price by the size of your contact base. Every dead, disposable, or role-based contact in that base is a line item on your monthly bill that will never produce engagement, replies, or revenue.
This cost is direct and ongoing. It doesn’t depend on whether you’re sending campaigns this month or what your reputation looks like; it’s just the per-contact billing across all your tools.
This number scales linearly with the size of your stack. Companies running ESP plus CRM plus marketing automation plus sales engagement plus customer success tooling can find that the per-contact cost adds up faster than they expect, especially at the higher tiers where each contact costs more individually.
Add up the per-contact line items across every tool that bills by contact volume. ESP, CRM, marketing automation, sales engagement, customer success, support tooling — anything where adding 10,000 records would change the bill. The total is what you’re actually paying per contact, and bad contacts cost you that full amount with no return.
Cost 6: Sales and Operational Time
This is the cost that doesn’t show up in any platform bill. It’s the time your sales reps spend emailing inboxes that don’t exist, the time your support team spends helping users who never received confirmation, and the time your RevOps team spends manually cleaning up records that should never have entered the system in the first place.
Time costs are real but harder to quantify, because they’re spread across team members and not tracked as a line item. The way to estimate them is to multiply the affected hours per month by the labor cost of the people doing work.
For RevOps and support, the calculation works the same way. The headline number is rarely huge for any one role, but it adds up across the organization, and it’s recurring.
Annual Cost of Bad Email Data: 100K-Contact Mid-Market Company Breakdown
Here’s the full math for a realistic mid-market scenario. Substitute your own numbers wherever you have them; the structure stays the same.
Company profile:
- 100,000 active email contacts.
- 4 marketing campaigns per month, plus a weekly newsletter and monthly product update.
- eCommerce: ~$65 revenue per conversion; ~22% baseline open rate.
- Estimated 8–12% bad data rate (typical for unverified lists with mixed sources).
- ESP, CRM, marketing automation, and sales engagement platforms in the stack.
The conservative number — somewhere between $100,000 and $150,000 a year — is the one we’d take into a budget meeting. It accounts for the overlap between reputation decay and lost revenue, uses moderate assumptions throughout, and leaves room for an executive to argue downward and still see a meaningful figure.
The deduplicated total is the right number to use in budget conversations. Reputation decay (cost #2) and lost revenue from suppression (cost #4) describe the same underlying phenomenon from different angles — mail that should have reached engaged subscribers landing in the wrong folder. Counting both fully overstates the case. Pick whichever framing fits your audience’s mental model and skip the other.
The 1M-Contact Enterprise Example
Same math, ten times the contacts. Most numbers scale roughly linearly, but two of them (reputation decay and ESP throttling) get worse at scale because the absolute volume of bad sends crosses provider thresholds faster.
Company profile:
- 1,000,000 active email contacts.
- Weekly campaigns plus triggered transactional sends; 4M+ monthly send volume.
- Mixed B2C and B2B; revenue model varies by segment.
- Estimated 10–15% bad data rate (typical for enterprise lists with multiple sources and aging data).
At enterprise scale, the cost categories that matter most shift slightly. Direct bounce damage is still small; reputation and throttling become the dominant drivers because the absolute volume of failed sends crosses provider thresholds more often.
Platform spend also scales because enterprise tier pricing is per-contact, and the per-contact rate is often higher than mid-market.
How Bad Email Data Costs Enterprises $800K–$1.2M+ Annually (1M Contacts Example)
Cold outbound is its own scenario, because the costs are different from broadcast marketing in two ways. First, the bad data rate is much higher (cold lists from data providers routinely have 20–30% invalid addresses).
Second, the reputation damage from cold outbound campaigns is concentrated and severe; a single bad send can collapse a domain’s deliverability for weeks.
Scenario profile:
- Sales team running cold outbound from 2 sending domains.
- 10,000 contacts per month per rep, across 10 reps = 100,000/month.
- Assumed bad data rate on imported lists: 25%.
- Average deal size: $5,000; conversion rate from positive reply: 3%.
Two things stand out in cold outbound. First, the deliverability events are episodic but expensive: one collapse can cost more than a full year’s worth of verification spend would have.
Second, sales rep time is the second-largest line item. When reps spend two hours a week on bad data, the loaded cost across a team adds up faster than any other category.
Assuming cold outbound bad-data costs are bounded because cold sending is sandboxed from your main programs. They’re not. Reputation damage on a sending domain affects every campaign that domain sends, including transactional and life cycle. Most companies that have lived through a cold outbound deliverability collapse will tell you the collateral damage to other email programs was the worst part.
Email Verification Costs Explained: The Other Side of the ROI Equation
Now the other side. To compute net ROI, you need the cost of verification itself. This is straightforward because verification vendors price per address with discounts at volume.
Approximate Verification Costs For The 3 Example Scenarios:
| Scenario | Annual verification cost (illustrative) | What it covers |
|---|---|---|
| Mid-market, 100K contacts | $2,000–$5,000 | Bulk re-verification 4x/year + real-time API on signups. |
| Enterprise, 1M contacts | $15,000–$40,000 | Quarterly bulk + ongoing real-time + bulk re-verification of imports. |
| Cold outbound, 100K monthly | $10,000–$25,000 | Bulk verification on every imported list before send. |
These are illustrative numbers and scale with the verification provider’s pricing. The pattern across all three scenarios is the same: verification cost is a small fraction of the cost of bad data, usually one to ten percent, depending on how aggressive your assumptions are.
Even at the conservative end of the bad-data calculations, the ROI is clear. For current EmailVerify.io pricing, including bulk credit packs and subscription tiers, see the pricing. You can plug those numbers into the ratio below for a more concrete answer.
Net ROI of Email Verification: Why It Delivers 25–30x Returns Across All Scenarios
The simplest way to summarize the ROI is the ratio of the cost of bad data to verification spend. For all three scenarios, the ratio comes out heavily in favor of verification.
The pattern is clear across scenarios. Even at the most conservative assumption set, verification produces an ROI in the 25–30x range. Tightening the assumptions still leaves a 5–10x ROI in most realistic scenarios. Verification is one of the highest-confidence ROI investments available in email infrastructure.
If your conservative ROI calculation produces a ratio under 5x, double-check two assumptions: (1) the bad data rate — if you’re assuming under 5%, you’re probably underestimating an unverified list, and (2) the reputation/lost revenue cost — if you’re assuming zero, you’re leaving the largest line item out of the calculation. Most of the time, the issue is one of those two, not the math itself.
When Email Verification ROI Calculations Break Down: The Limitations Explained
This calculation is honest about its limits. 3 situations make it less reliable, and you should call them out openly rather than pretend the model handles every case.
1. Very Small Lists
For lists under about 10,000 contacts, the absolute cost numbers are small enough that the calculation produces ROI ratios that don’t move the budget needle. The qualitative argument (clean data is better) still applies, but the math is less compelling. Most small companies are better served by buying verification for hygiene reasons rather than ROI reasons.
2. Highly Engaged Customer Bases with Good Hygiene Already
If your list is mostly engaged subscribers from a clean signup form with verification already in place, the bad data rate is probably low (1–3%), and the cost of bad data is correspondingly small. The ROI of adding more verification at this point is incremental, not dramatic. Make sure your assumed bad data rate matches reality before applying the model.
3. Transactional-Only Email Programs
Companies that only send transactional email (password resets, receipts, account confirmations) have a different cost structure. The revenue-per-engagement number is hard to pin down because the engagement is upstream of revenue, not directly tied to it. The calculation still works, but you’ll need to substitute different inputs (e.g., support cost per failed activation, reactivation rate, customer LTV impact) instead of the standard revenue numbers.
In all three of these cases, the framework is still useful; you just need to swap the inputs to fit the situation. The 6 categories of cost don’t change.
How to Justify Email Verification in Budget Conversations (ROI & Business Case Guide)
If you’re going into a budget meeting to get verification approved, this article is the framework. Here’s how to use it.
1. Build the Single-Page Summary
Don’t bring all six cost categories. Pick the two or three biggest ones for your business (typically reputation decay, lost revenue, and platform spend) and build a single-page summary with your actual numbers in those categories. Show the conservative deduplicated total alongside the verification cost. The ratio is what closes the conversation.
2. Anticipate the Pushback
The most common pushback is on the reputation decay number, because it’s the largest single line and the hardest to attribute. The defense is to use conservative inputs (3–5 percentage points of inbox placement degradation, not 10–15) and to point out that any positive reputation cost makes verification ROI-positive at any reasonable verification price.
3. Frame It as Insurance, Not Optimization
Most stakeholders will accept a 25x ROI argument, but the more durable framing is risk reduction. Verification reduces the probability of a deliverability collapse, the cost of which is binary: it either happens (and costs months of recovery) or it doesn’t. Insurance framing is easier to defend than optimization framing because it doesn’t depend on the specific revenue assumptions in the model.
Budget meeting prep checklist:
- Three concrete cost numbers from your own data, not from this article.
- Conservative deduplicated total alongside verification spend.
- ROI ratio (cost of bad data ÷ verification cost).
- One sentence on the deliverability-collapse insurance angle.
- Sample of 1,000 addresses from your current list, run through verification, showing the actual bad-data rate.
How EmailVerify.io Helps Run This Calculation?
If you want to plug your own data into this calculation rather than work from placeholder numbers, the easiest start is to run a sample of 1,000 addresses from your current list through verification.
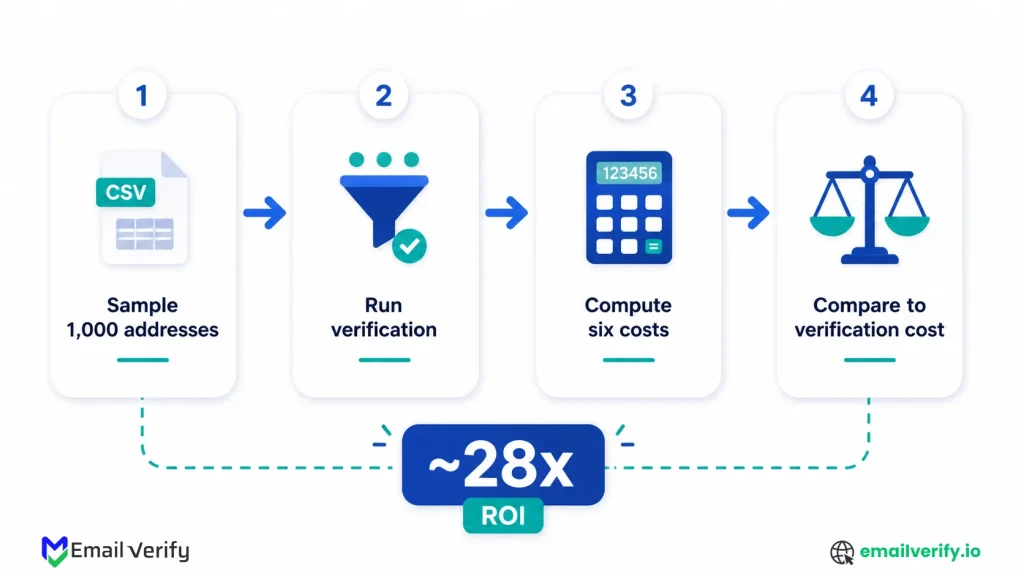
The output gives you your actual bad-data rate, broken down by category (deliverable, risky, unknown, undeliverable, disposable, and catch-all). That number replaces the bad_data_rate placeholder in every calculation in this article and turns the framework into a concrete cost estimate for your business.
Run the sample through EmailVerify.io bulk verification. For a broader context on how verification fits into ongoing list hygiene, our companion guide on email list cleaning covers the full operational pattern. And if you’re trying to estimate the bounce-rate side of the model specifically, our guide on email bounce rate walks through what mailbox providers actually consider acceptable.
EmailVerify.io’s structured output is designed for exactly this kind of analysis. Every result includes a primary status, reason codes, and the underlying signals (catch-all, role, disposable, free provider). That means you can not only count the bad data rate but also break it down by reason, which often surfaces opportunities to fix the upstream problems producing the bad data in the first place: a signup form that’s collecting too many disposable addresses, a vendor list that’s heavily catch-all, or a CRM segment that’s gone stale.
Issues like spam traps often sit behind the scenes in list degradation and deliverability drops without obvious signals until performance starts to slip, especially when patterns similar to spam traps start affecting list quality over time.
When teams start measuring real outcomes, the impact of verification becomes clearer in terms of bounce reduction and ROI improvement, especially how EmailVerify can help you reduce bounce rate and improve ROI.
Frequently Asked Questions
What's the Biggest Cost Category?
For most companies, sender reputation decay and the lost revenue that follows from it together account for 60–80% of the total. These two costs overlap (they describe the same underlying phenomenon, mail that should have reached engaged subscribers landing in spam), so for budget conversations, count one or the other, not both. Direct bounce damage is the smallest meaningful cost in most cases.
Is verification really worth it for a small list?
It depends. For lists under about 10,000 contacts, the absolute dollar costs are small enough that the ROI calculation isn't dramatic. Verification still produces cleaner data and protects sender reputation, but the financial argument is less compelling. For lists above 10,000, especially if you send regularly, the cost of bad data scales fast enough that verification almost always pays for itself within months.
Can I really expect a 25–30x ROI from verification?
In conservative scenarios with realistic inputs, yes. The reason the ratio is so high is that verification cost is a small per-contact fee and the cost of bad data is dominated by reputation and lost-revenue effects that are several orders of magnitude larger. Tighten the assumptions further, and the ratio still typically lands in the 5–10x range; few infrastructure investments are this clearly ROI-positive.
How Do You Calculate This For My Own Company?
Start by sampling 1,000 addresses from your current list and running them through a verifier to find your real bad-data rate. Then plug that rate into the six calculation blocks in this article, replacing the other placeholder values with your own numbers (monthly send volume, ESP cost per message, revenue per engagement, list size, etc.). The total takes about 30 minutes once you have the inputs in hand.
What If Your List Is Already Pretty Clean?
If you've been verifying at signup and re-verifying on a schedule, your bad-data rate is probably 1–3%, and the cost of bad data is correspondingly small. The framework still works — the cost just comes out lower because the inputs are lower. In this scenario, the ROI argument shifts from "clean up the existing mess" to "prevent the next mess from happening," which is still real but harder to put a single dollar number on.
How does cold outbound differ from broadcast marketing?
The bad-data rate is much higher (20–30% on cold lists from data providers), and reputation damage events are more frequent and more concentrated. A single large send to an unverified cold list can collapse a sending domain's reputation for weeks, with collateral damage to transactional and lifecycle email programs. The cost of bad data in cold outbound is dominated by these episodic events and by sales rep time spent on bad addresses.
How Do You Justify Verification To A CFO?
Frame it as risk reduction rather than optimization. The expected value of verification (25–30x ROI in typical scenarios) is the optimization framing. The risk-reduction framing is that verification prevents deliverability collapse events whose cost is binary and high. CFOs tend to be more comfortable with insurance-shaped arguments than with assumption-laden optimization arguments. Both are true; pick the one that fits your audience.
How Often Should You Redo This Calculation?
Annually is reasonable, alongside any major changes in list size, sending strategy, or platform stack. The numbers shift over time as your list grows, your platforms change pricing, and provider deliverability rules tighten. An annual refresh keeps the budget conversation grounded in current numbers rather than two-year-old assumptions.
What's The Fastest Way To Get A Real Cost Number For My Company?
Verify a 1,000-address sample of your list, get your real bad-data rate, and apply the formulas in Sections 4–9 with your own monthly send volume and revenue inputs. The whole process takes about 30 minutes once you've gathered the inputs, and the resulting number is specific to your data, which is what makes it persuasive in a budget conversation.
Final Thoughts
Bad email data is a tax on every email program that doesn’t pay it visibly. It shows up across multiple budgets and ownership areas, which is why most teams haven’t quantified it and why the cost compounds in the background while everyone assumes it’s small.
The math in this article is the antidote: a structured way to surface the costs, sum them honestly, and put them next to the cost of doing something about it. The framework is more important than the specific numbers. Plug in your own monthly send volume, your own revenue per engagement, and your own bad-data rate from a sample verification run, and the calculation produces an answer that’s specific to your business.
That answer is almost always large enough to make verification an obvious budget item, and the ROI ratio (typically 25–30x in conservative scenarios) is high enough that it survives most attempts to argue it down.
Issues like spam traps often sit behind the scenes in list degradation and deliverability drops without obvious signals until performance starts to slip, especially when patterns similar to spam traps start affecting list quality over time.
When teams start measuring real outcomes, the impact of verification becomes clearer in terms of bounce reduction and ROI improvement, especially how EmailVerify can help you reduce bounce rate and improve ROI.
If you’re going into a budget meeting on this topic, the single most useful preparation is a 1,000-address sample run through verification.
The output gives you your real bad-data rate; the rate gives you the inputs for the formulas, and the formulas give you the dollars. The conversation gets short after that.
Cleaner data costs less than dirty data. That’s the conclusion at every list size, in every scenario this article modeled. The math just makes it harder to ignore.
Run the calculation on your own data
Get a clear ROI estimate from your own email list in under 30 minutes.


